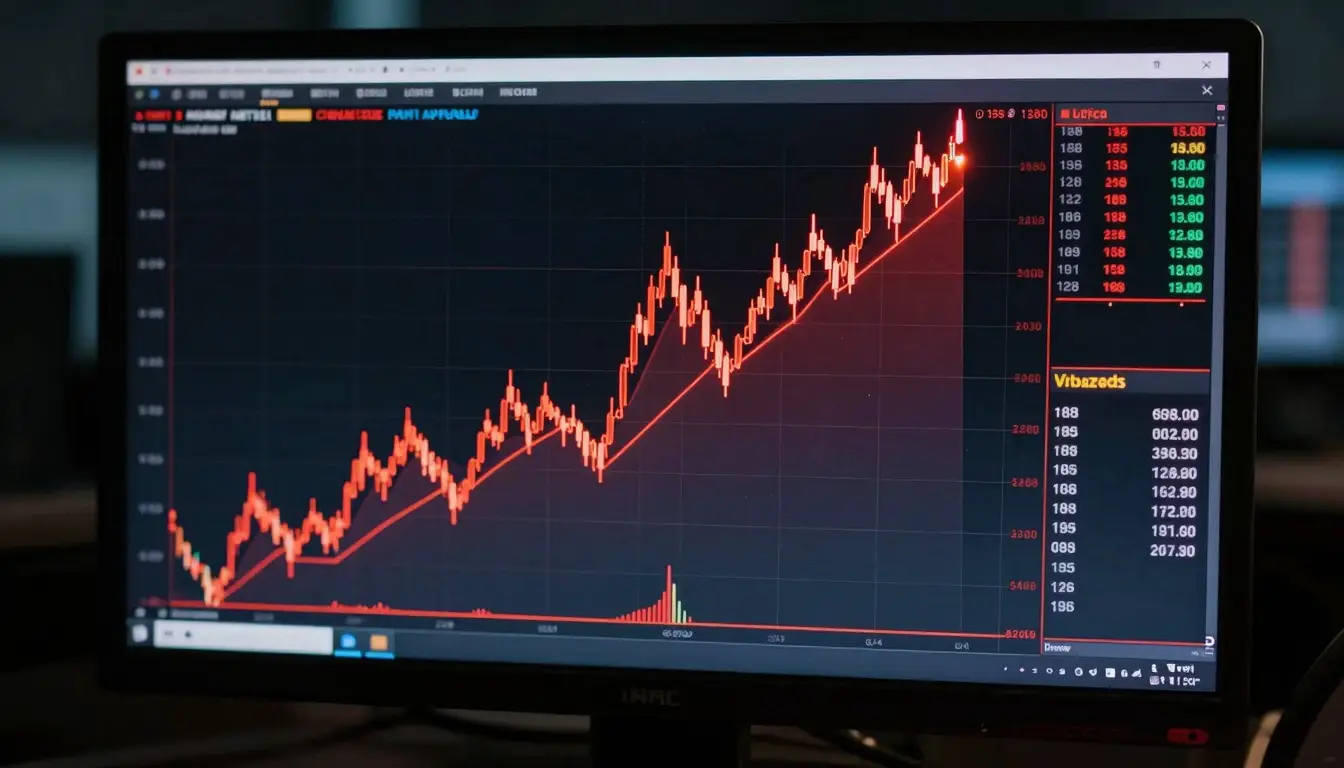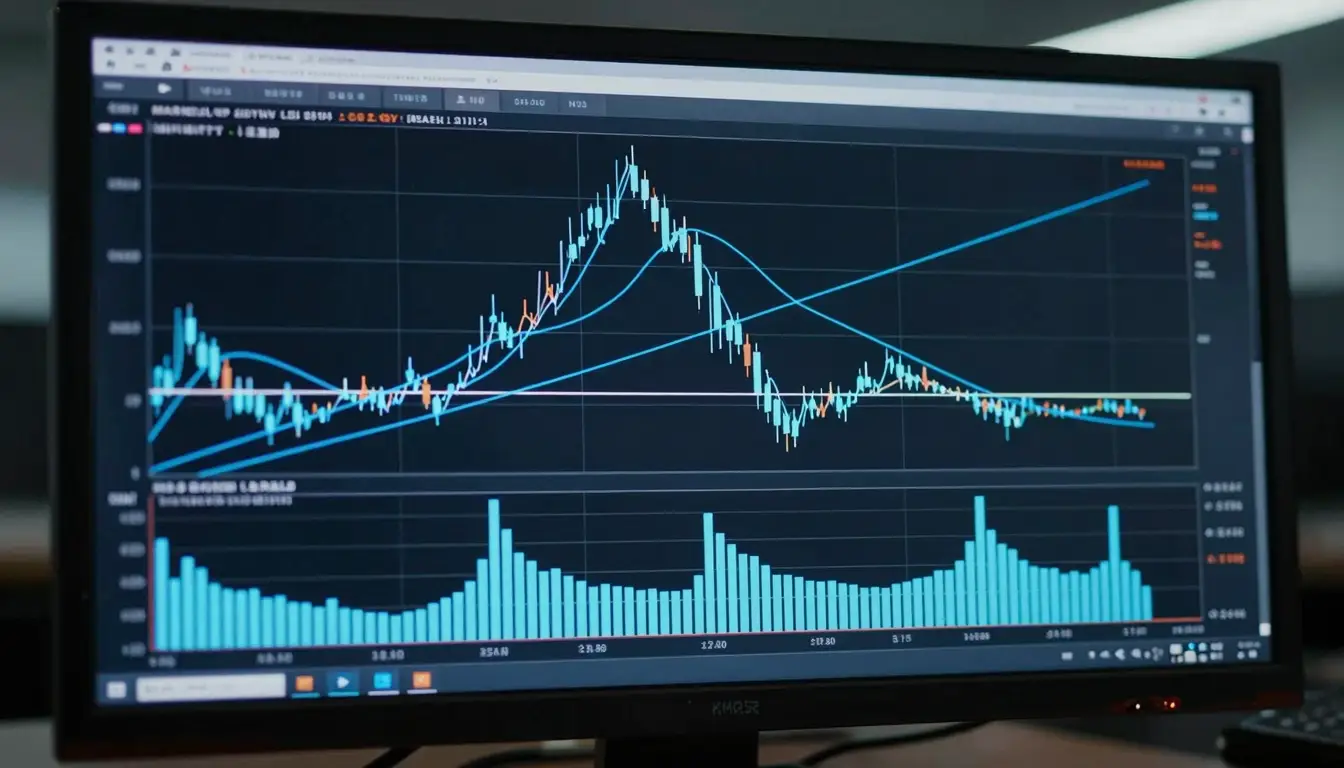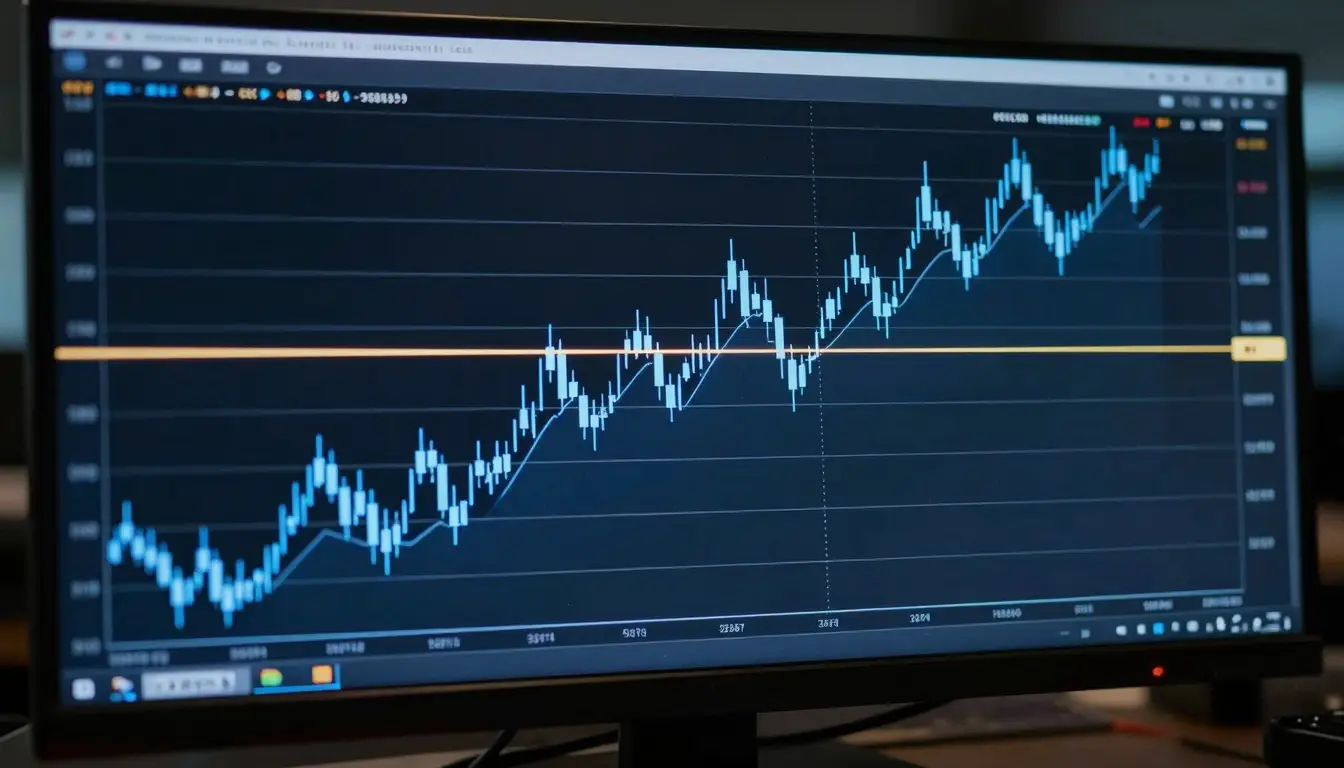
Candlestick patterns are shapes formed by one or more price candles that traders read as clues about market sentiment and the likely next move. Each candle shows the open, high, low, and close for a period, and certain shapes, a long lower wick, one candle engulfing another, tend to appear at turning points. They signal probability, not certainty: a pattern that worked ten times can fail on the eleventh. This guide explains how to read a candle, the patterns worth knowing, and how to trade them without falling for the common traps.
Key points:
- A candle shows four prices: open, high, low, close. The body is open-to-close; the wicks are the highs and lows.
- Patterns hint at whether buyers or sellers are winning, and whether a move may reverse or continue.
- Context decides everything: the same pattern means more at support, in a clear trend, on a higher timeframe.
- Patterns are probabilities. Always wait for confirmation and pair them with a stop-loss.
- The most useful for beginners: doji, hammer, engulfing, and the morning/evening star.
What is a candlestick?
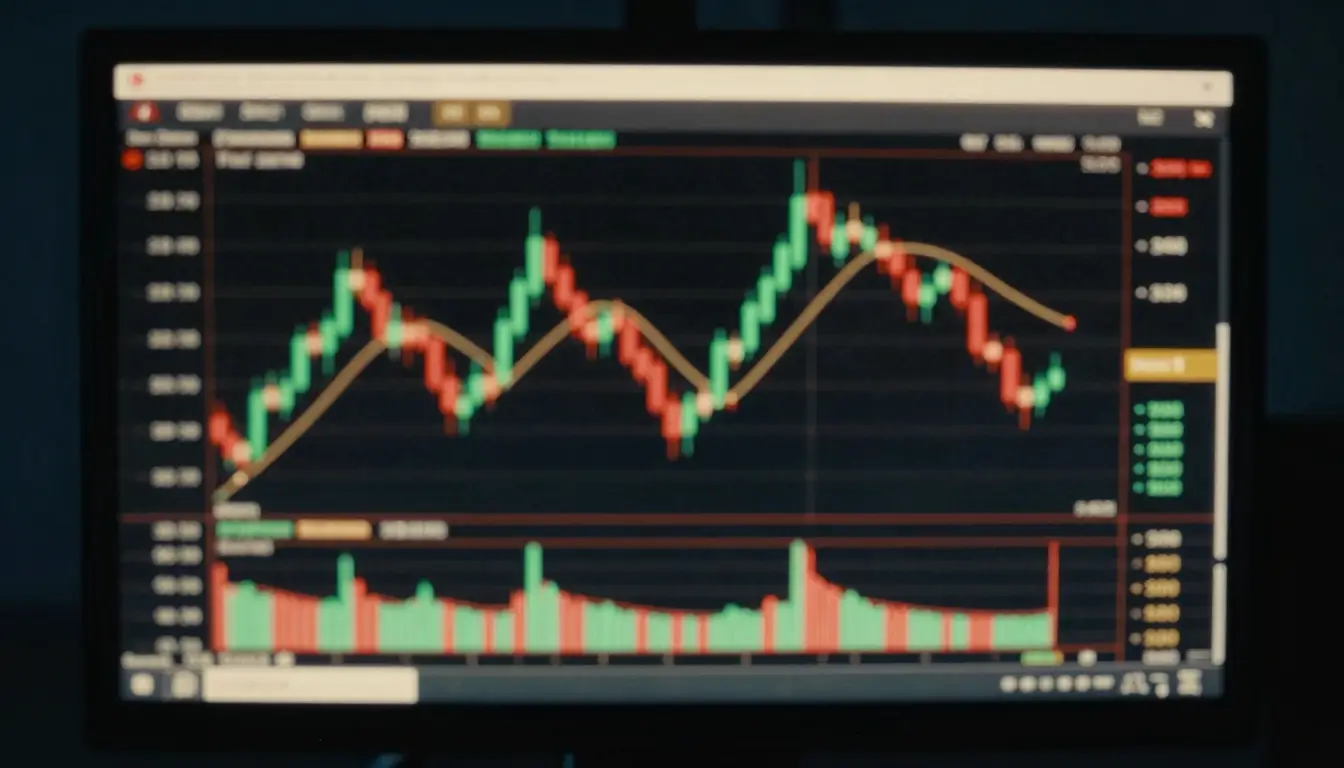
A candlestick summarises a single period of trading, one minute, one hour, one day, depending on your chart, into four prices. The body is the block between the open and the close: a green (or hollow) body means the price closed higher than it opened, a red (or filled) body means it closed lower. The thin lines above and below, the wicks or shadows, mark the highest and lowest prices reached during the period.
That shape carries information. A long green body with short wicks says buyers dominated the whole period. A small body with a long lower wick says sellers pushed the price down but buyers fought it back up before the close. Candlestick reading, developed by Japanese rice traders in the 18th century, is simply the practice of interpreting these shapes and their sequences.
What do candlestick patterns actually tell you?
Patterns describe the balance of power between buyers and sellers, and they fall into two broad groups. Reversal patterns suggest a trend may be running out of steam and about to turn, a hammer after a downtrend, for example. Continuation patterns suggest a pause before the existing trend resumes. Neither predicts the future; both describe what just happened to sentiment and let you weigh the odds of what comes next.
The critical word is probability. A bullish engulfing pattern does not mean the price will rise; it means buyers just overwhelmed sellers in a way that often precedes a bounce. Used well, patterns tilt the odds slightly in your favour. Used as guarantees, they empty accounts.
The most important single-candle patterns
- Doji. Open and close are almost equal, leaving a tiny body with wicks on both sides. It signals indecision, buyers and sellers cancelled out. After a strong trend, a doji is an early warning that momentum is fading.
- Hammer. A small body near the top with a long lower wick, appearing after a downtrend. Sellers drove the price down, but buyers reclaimed most of the loss by the close, a potential bottom.
- Shooting star. The mirror image: a small body near the bottom with a long upper wick after an uptrend. Buyers pushed up but sellers slammed it back, a potential top.
- Marubozu. A long body with almost no wicks. One side won decisively for the whole period, strong momentum in that direction.
None of these is tradable on its own. A hammer in the middle of a range means little; a hammer at a level where the price has bounced before, on a daily chart, is worth attention.
The key two- and three-candle reversal patterns
- Bullish engulfing. A small red candle followed by a larger green candle whose body completely covers it. Buyers didn’t just win, they erased the previous period’s selling. Strong reversal signal after a downtrend.
- Bearish engulfing. The opposite, a green candle swallowed by a larger red one after an uptrend.
- Harami. A large candle followed by a small one contained within its body, a sign the trend’s momentum is shrinking and a reversal or pause may follow.
- Morning star. A three-candle bottom: a long red candle, a small indecisive candle, then a long green candle. Sellers exhausted themselves and buyers took over.
- Evening star. The three-candle top: long green, small candle, long red.
- Tweezer top/bottom. Two candles with matching highs (top) or lows (bottom), showing a price level that rejected the move twice.
What about continuation patterns?
Not every pattern signals a reversal. Continuation patterns tell you a trend is only taking a breath before it resumes. The rising three methods is a long green candle, a few small red candles that stay within its range, then another long green candle, buyers absorbing a small pullback before pushing on. The falling version signals the same in a downtrend. For a beginner these matter less than the reversal patterns, but they are a useful reminder that a cluster of small candles against the trend is often just a breather, not a turn.
How do you actually trade candlestick patterns?
A pattern is a prompt to look closer, not a signal to click buy. Four habits turn patterns from noise into an edge:
- Demand context. A reversal pattern means far more at a key level the price has respected before than in the middle of nowhere. Mark your support and resistance first, then watch for patterns there.
- Trade with the higher-timeframe trend. A bullish pattern in a market that is falling on the daily chart is fighting the tide. Patterns that agree with the bigger trend have better odds.
- Wait for confirmation. Rather than entering on the pattern candle, many traders wait for the next candle to move in the expected direction, or for a break of the pattern’s high or low. It costs a little entry price for a lot less false-signal risk.
- Define your risk before you enter. Place a stop-loss beyond the pattern (below a hammer’s wick, for instance) and size the position so the loss is a small, fixed percentage of your account. Judge the trade with a risk-reward ratio before committing.
What mistakes do beginners make with candlesticks?
The classic error is trading every pattern in isolation, treating each doji or hammer as a signal regardless of where it appears. Patterns on a one-minute chart fire constantly and mostly mean nothing; the same pattern on a daily chart at a major level is a different proposition. A second common mistake is ignoring the trend and taking reversal signals against strong momentum. A third is skipping confirmation and entering on the pattern candle itself, then being stopped out by the noise that follows. Candlestick reading is a lens for sentiment, and it works best combined with emotional discipline and other tools such as momentum indicators.
Related reading
- Stop-loss orders: where to place them and the trade-offs involved
- Risk-reward ratios: what they mean and how to use them before entering a trade
- Trading psychology: how fear and greed affect decisions
- RSI, MACD, and Bollinger Bands: how these indicators work
Frequently asked questions
Are candlestick patterns reliable?
They are useful but not reliable in the sense of being predictive. A candlestick pattern shifts the odds of the next move slightly, it does not fix it. Reliability improves sharply when a pattern appears in the right context: at a support or resistance level, in the direction of the higher-timeframe trend, and confirmed by the following candle. On its own, in the middle of a range, any single pattern is close to a coin toss.
What is the most powerful candlestick pattern?
There is no single “most powerful” pattern, but the engulfing pattern and the morning/evening star are among the most watched reversal signals because they show a decisive shift in control from one side to the other. Their strength comes from where they appear as much as from the shape itself. An engulfing candle at a major level on a daily chart carries far more weight than the same shape on a one-minute chart.
Which timeframe is best for candlestick patterns?
Higher timeframes produce more meaningful signals because each candle represents more trading activity and more participants. Patterns on the daily and 4-hour charts are generally more reliable than those on the 1-minute or 5-minute charts, where random noise creates constant false patterns. Beginners are usually better served focusing on the daily chart, where a pattern reflects a full day’s balance of buyers and sellers.
Do I need candlestick patterns to trade?
No. Plenty of profitable traders rely on trend, levels, and risk management without naming patterns at all, and candlestick reading is one tool among many, not a requirement. What every trader does need is risk control: a stop-loss and sensible position sizing. Candlestick patterns can sharpen your entries, but they never replace the discipline that keeps a losing trade small.
What is the difference between candlestick patterns and chart patterns?
Candlestick patterns are formed by one to three individual candles and describe short-term sentiment. Chart patterns, such as head and shoulders, triangles, or double tops, are larger formations built from many candles over a longer stretch and describe the broader structure of price. The two work together: a candlestick reversal signal appearing at the neckline of a chart pattern is a stronger cue than either on its own.
This article is educational and not financial advice. Trading carries risk and most retail accounts lose money. Candlestick patterns indicate probability, not certainty. VLT Markets is a publisher, not a broker.