Open interest (OI) is the total value (or number of contracts) of outstanding derivatives positions that have been opened and not yet closed or settled. It measures the total size of active bets in a market. Rising OI means new money is entering; falling OI means positions are being closed.
How open interest works
Every futures or options contract involves two parties: one long and one short. When a new buyer and seller open a contract, OI increases by one contract. When one party closes against another party who opens (one closes, one opens), OI stays the same. When two existing holders close against each other, OI decreases by one contract. OI is therefore a measure of outstanding exposure, not trading volume.
OI is tracked separately from volume. A market can have high volume and falling OI (existing positions closing quickly), or low volume and rising OI (slow accumulation of new positions). Both have different implications for what follows.
What this means for traders
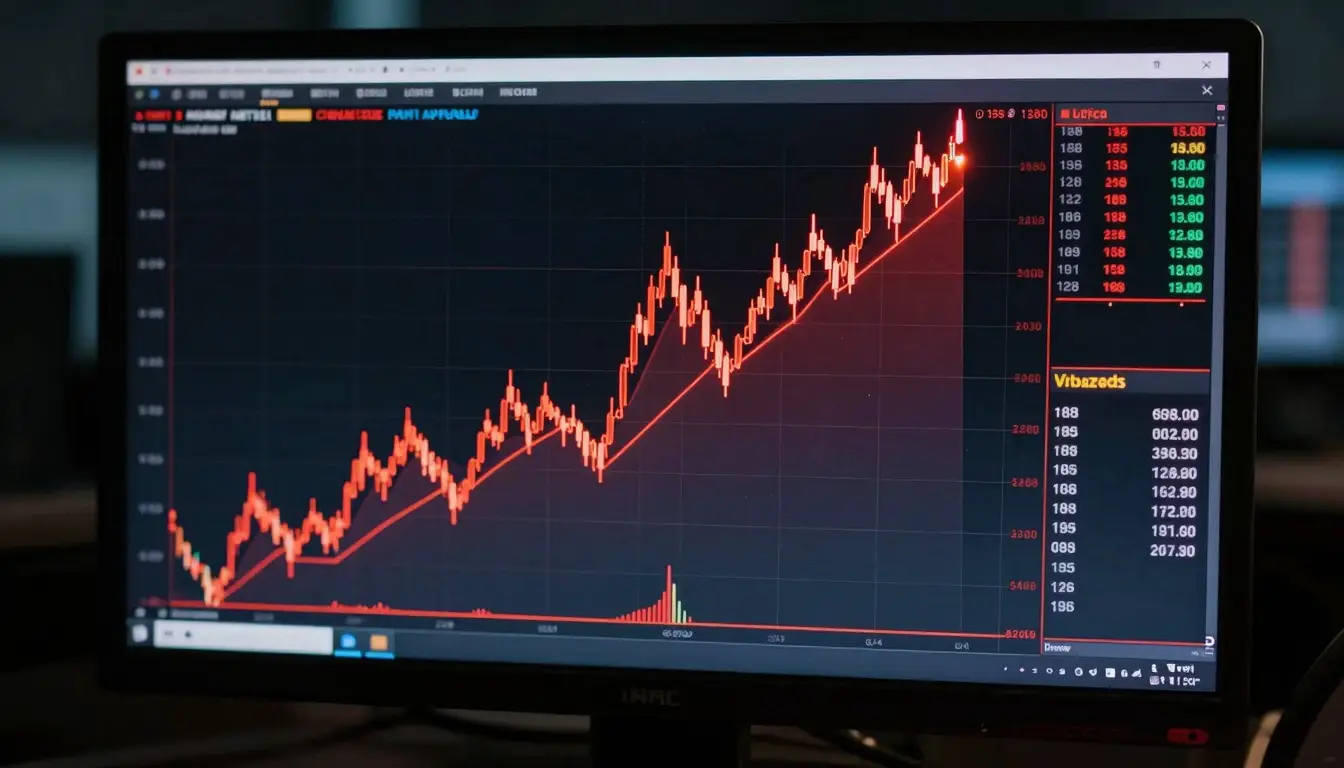
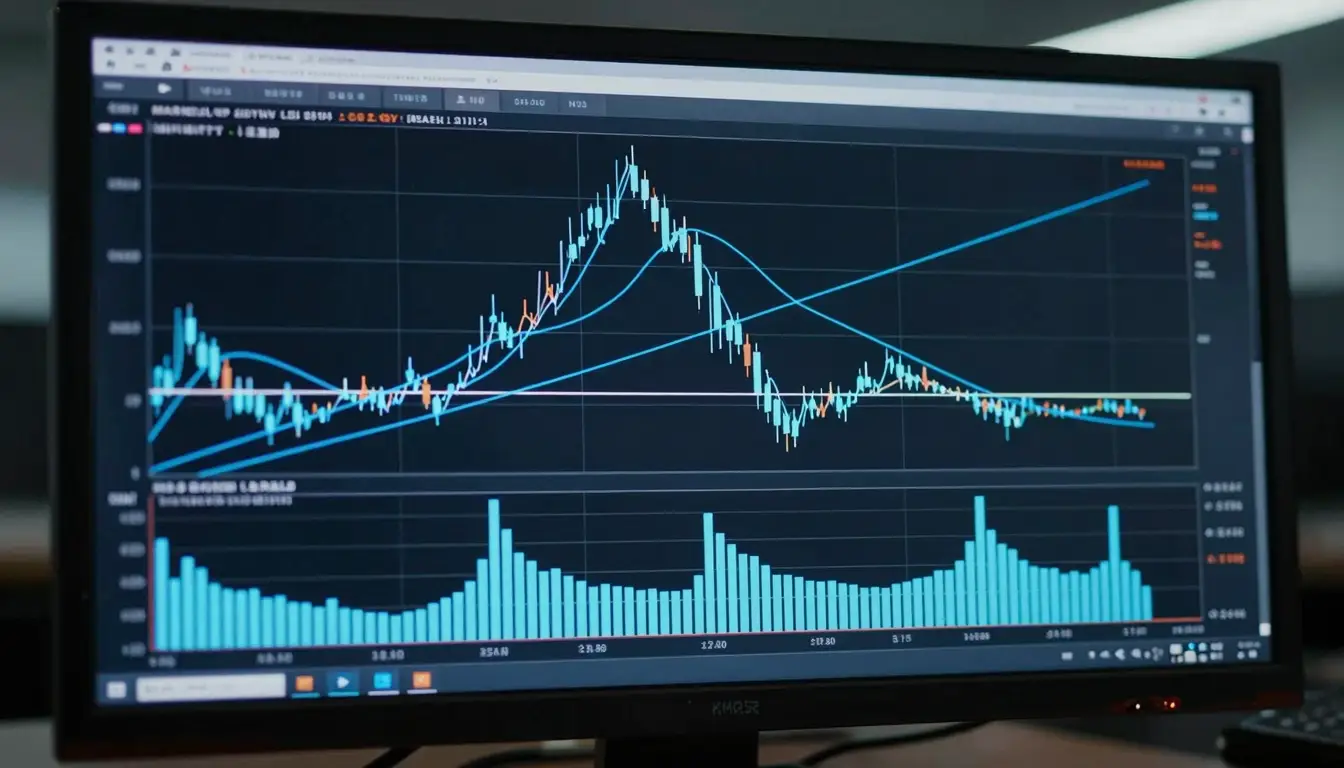
OI combined with price action gives a clearer picture than price alone. Rising price with rising OI suggests new buyers are driving the move, which is a stronger signal than rising price with falling OI (which suggests short covering that is less likely to sustain). Extreme OI levels, especially when paired with elevated funding rates, signal over-leveraged markets where a sharp reversal can cascade into a liquidation spiral.
Watching OI at specific price levels helps anticipate where cascades might start. Coinglass shows estimated liquidation levels, the approximate price points where large clusters of positions would be forced to close. A large concentration of long liquidations just below the current price means a dip toward that level could trigger a flush. For how OI fits within broader technical analysis, see technical analysis in crypto and crypto futures explained.
A concrete example
Bitcoin’s aggregate open interest across exchanges reached $40 billion in January 2024. When BTC pulled back 12% from its local high shortly after, approximately $1.2 billion in long positions were liquidated within 24 hours. The elevated OI amplified a moderate price move into a significant liquidation event. Traders who had noted the record OI alongside 0.08% funding rates reduced their long exposure ahead of this, not because they predicted the exact move, but because the setup indicated elevated risk regardless of direction.
Frequently asked questions
Where can I track open interest data?
Coinglass aggregates OI across all major exchanges and displays it alongside price charts. It also shows historical liquidation heatmaps, useful for identifying price zones where large position clusters would be forced to close. CoinGlass is free to use for the main metrics.
Is high open interest bullish or bearish?
Neither by itself. High OI means the market is active and leveraged. Whether that leverage is predominantly long or short determines the directional bias. Check the long/short ratio alongside OI. Most exchanges publish this in their data dashboards.
What is the difference between OI and volume?
Volume counts every trade that executes, including trades that open and close positions. OI only counts the net outstanding positions remaining open. A market can have very high volume (many people trading in and out quickly) and stable or falling OI if most of those trades close existing positions rather than open new ones.