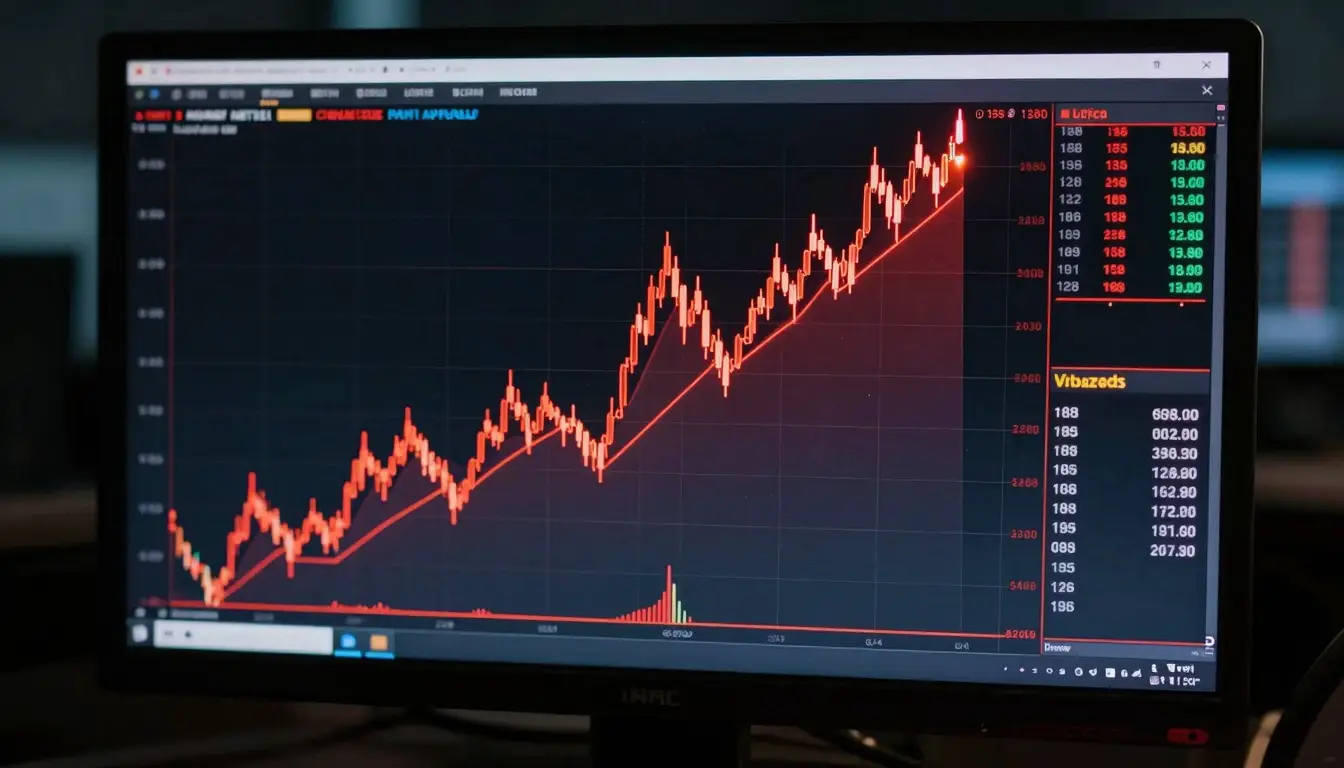
Crypto market cycles are the recurring patterns of price expansion and contraction that have historically tracked Bitcoin’s four-year halving schedule. Each cycle has followed a broadly similar arc: post-halving accumulation, an altcoin season where smaller coins outperform BTC, a blow-off top, and a prolonged bear market that retraces 70–85% from the peak before the next cycle begins.
The historical cycle pattern
Cycle 1 (2012–2016): Bitcoin halved in November 2012 from 50 to 25 BTC per block. Price went from roughly $12 pre-halving to $1,163 at the 2013 peak, a 97x move. The bear market bottomed near $170 in January 2015. Cycle 2 (2016–2020): halving in July 2016 (25 to 12.5 BTC). Peak at $19,891 in December 2017, an 80x from the 2015 bottom. Bear market bottomed at $3,122 in December 2018, a 84% drawdown. Cycle 3 (2020–2024): halving in May 2020 (12.5 to 6.25 BTC). Peak at $69,044 in November 2021. Bottom at $15,479 in November 2022, a 78% drawdown from the peak. Cycle 4 (2024–?): halved in April 2024 (6.25 to 3.125 BTC). As of mid-2025, Bitcoin hit a new all-time high of $109,000+ in January 2025 driven partly by spot ETF inflows, which added an institutional demand variable absent from previous cycles.
The thesis behind the cycle: each halving cuts the daily supply of new BTC by 50%. If demand stays constant or grows, price must rise to clear the market. The effect takes 12–18 months to fully propagate as existing miners adjust, marginal sellers are priced out, and retail attention follows the price rise. The role of Bitcoin’s supply mechanics is detailed in our Bitcoin halving explainer.
What this means for traders
The cycle framework is useful as a base case but dangerous as a precise timer. Each cycle has been longer and the percentage returns smaller: 97x, 80x, 20x (from the 2018 bottom to the 2021 peak). If cycles compress further, 2024–2025 might deliver a 5–8x from the cycle low, but not another 80x. Several structural changes complicate the pattern: spot Bitcoin ETFs now allow institutional flows to bypass halving mechanics entirely, stablecoin liquidity has ballooned to $200B+ creating a different market structure than 2017, and global macro conditions (interest rates, risk-off sentiment) now influence crypto meaningfully in ways they did not before 2020.
The on-chain metrics most predictive historically: MVRV ratio above 3.5 has coincided with all three previous cycle tops within a few months; MVRV below 1.0 with every major bottom. Pi Cycle Top indicator (a specific moving average crossover) correctly called the 2021 top within three days. No indicator works perfectly every cycle. The MVRV metric is covered in more detail in our MVRV ratio explainer. For how to use these signals in portfolio decisions, see our portfolio construction guide.
A concrete example
A trader using the four-year cycle framework in early 2023 would have treated Bitcoin at $16,000–$20,000 (12–18 months post-peak, deep in bear territory) as a structurally attractive accumulation zone, consistent with previous cycle bottoms. A $10,000 position at $17,000 in January 2023 reached $64,000 by March 2024, a 3.76x return, well within historical cycle expectations. The framework didn’t predict the precise bottom ($15,479 in November 2022) or the exact top, but it identified the regime correctly. A trader who waited for “cycle confirmation” and bought at $30,000 in June 2023 still made a reasonable return, while one who front-ran the cycle bottom too aggressively in November 2022 bought at what turned out to be close to the actual low.
Frequently asked questions
Will cycles continue as Bitcoin becomes more mature? Probably yes, but they will compress. As Bitcoin’s market cap grows, the supply shock from each halving represents a smaller percentage of overall market activity. ETF demand and macro flows increasingly dominate price action in ways that make the halving supply-side effect less determinative. Most analysts expect the cycle to persist but the amplitude to decrease.
Do altcoins follow the same cycle? Generally yes, but with amplification. Altcoins typically underperform BTC early in a cycle (investors rotate to safety), then dramatically outperform in the final 6–12 months (the “altseason”). In 2021, many altcoins returned 20–100x from their 2020 lows while BTC returned about 17x. They also crash harder: most 2021 altcoins fell 90–99% in the 2022 bear market.
Is there a reliable signal for altseason? The Bitcoin Dominance chart (BTC’s share of total crypto market cap) is the most-watched. When BTC dominance falls from a high (above 50%) back toward 40%, it historically signals capital rotating into altcoins. This is imprecise, dominance can fall for months before altcoins peak, but it tracks the directional rotation reasonably well.