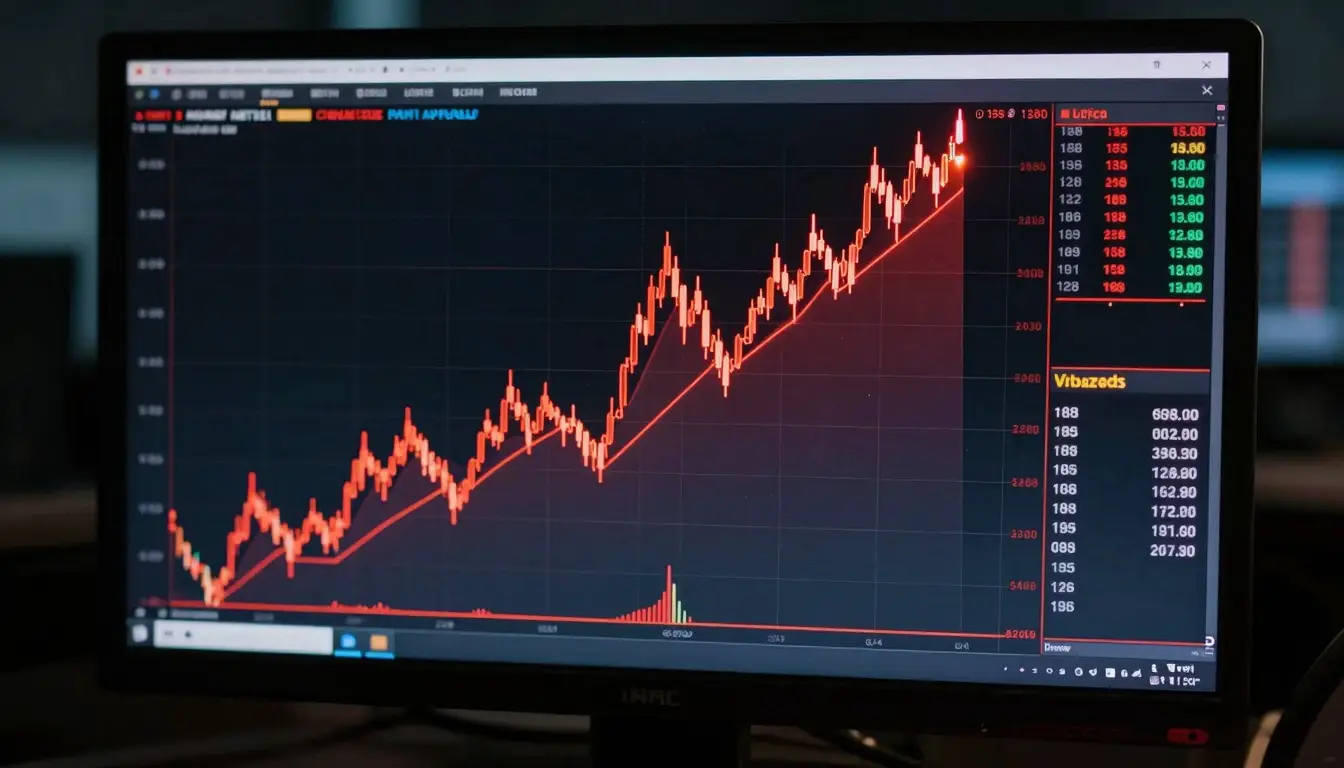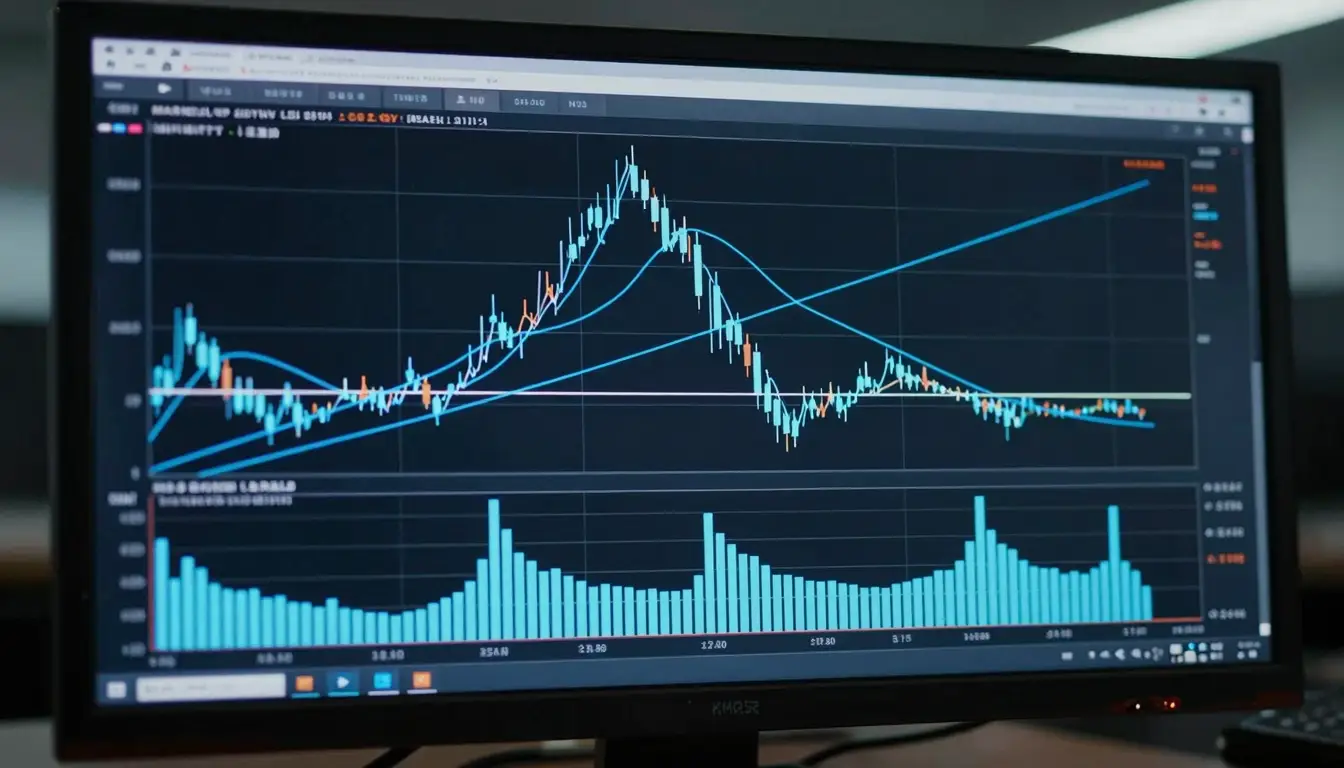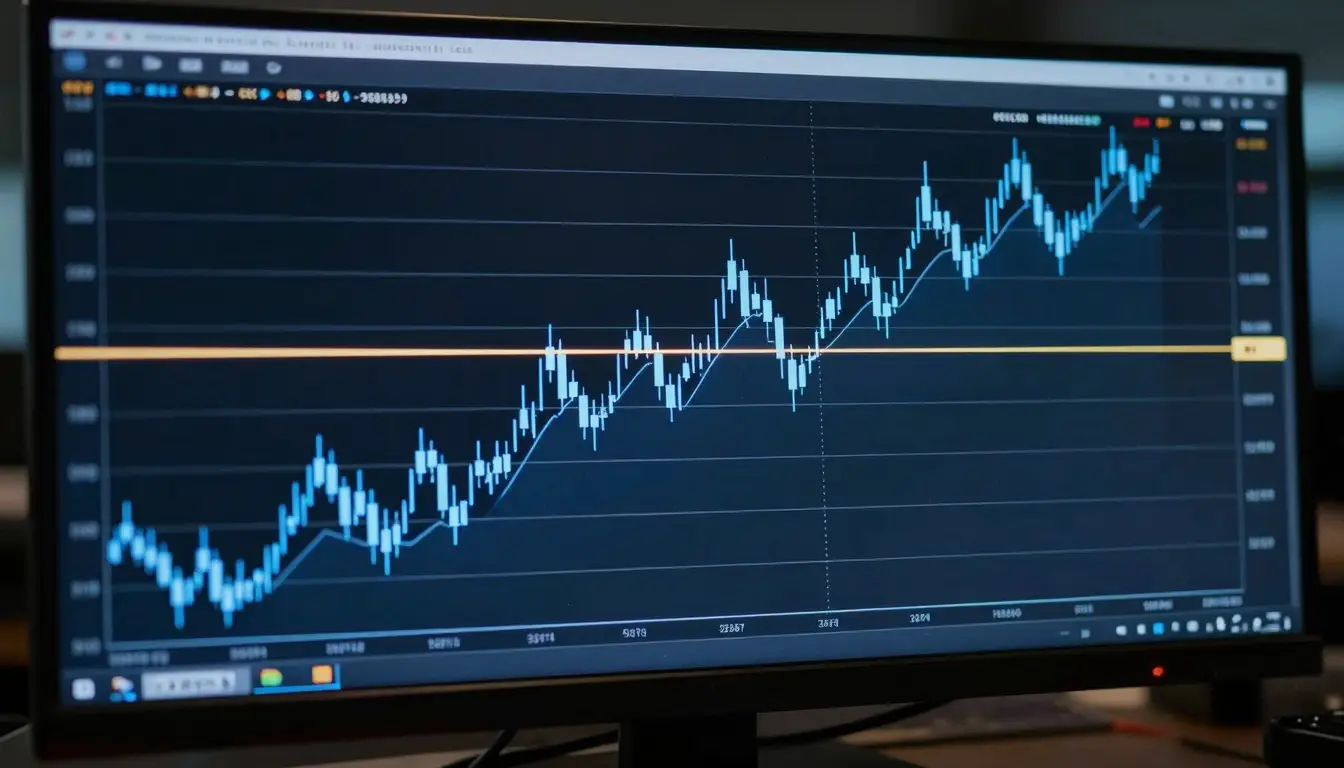
Fibonacci retracement is a technical analysis tool that marks potential support and resistance levels using ratios derived from the Fibonacci number sequence. After a strong price move, markets often pull back part of the way before continuing, and Fibonacci retracement levels, the best known being 38.2%, 50%, and 61.8%, help traders anticipate how far that pullback might go. You draw the tool from the low to the high of a move (or vice versa), and it plots horizontal lines at these ratios. Traders watch them as possible places where the price could pause and resume the trend. This guide explains the levels, how to use them, and their limits.
Key points:
- Fibonacci retracement plots potential support and resistance levels from ratios like 38.2%, 50%, and 61.8%.
- It is used to estimate how far a price might pull back before the trend resumes.
- You draw it between the start and end of a significant move; the levels appear as horizontal lines.
- The 50% and 61.8% levels are the most watched, but the tool is a guide, not a precise predictor.
What is Fibonacci retracement?
The tool takes its name from the Fibonacci sequence, a series of numbers where each is the sum of the two before it (1, 1, 2, 3, 5, 8, 13, and so on). Ratios between these numbers produce percentages that appear throughout nature and, many traders believe, in markets too. In trading, the key retracement levels are 23.6%, 38.2%, 50%, 61.8%, and sometimes 78.6%. The idea is that after a price makes a strong move, a pullback often stalls and reverses near one of these levels before the original trend continues. The 61.8% level, known as the “golden ratio”, gets the most attention, with 50% (not strictly a Fibonacci number but widely used) close behind.
How do you draw Fibonacci retracement levels?
Every charting platform has the tool built in, so you do not calculate anything by hand. You select the Fibonacci retracement tool and click from the start of a significant move to its end: from the swing low to the swing high in an uptrend, or from the swing high to the swing low in a downtrend. The platform then draws horizontal lines at each ratio between those two points. In an uptrend, these levels sit below the high and mark where a pullback might find support; in a downtrend, they sit above the low and mark where a bounce might meet resistance. The quality of the levels depends entirely on choosing a clear, meaningful swing to draw from.
How do traders use Fibonacci retracement?
The most common use is to find potential entry points in the direction of the trend. In an uptrend, a trader might wait for the price to pull back to the 38.2% or 61.8% level and look to buy there, betting the trend will resume, with a target back towards the previous high. The levels are also used to place stops (just beyond a level that should hold if the idea is right) and to set profit targets. Crucially, most experienced traders do not trade a Fibonacci level in isolation. They look for confirmation, such as the level lining up with an existing support or resistance zone, a trendline, or a candlestick signal. A Fibonacci level that coincides with another form of support is far more convincing than one floating on its own.
The main retracement levels
- 23.6%: a shallow pullback, often seen in very strong trends where the price barely pauses.
- 38.2%: a common, moderate retracement level watched closely in trending markets.
- 50%: not a true Fibonacci ratio but widely used, marking a halfway pullback of the prior move.
- 61.8%: the “golden ratio” and the most watched level; a deep pullback that still often holds in a healthy trend.
- 78.6%: a deep retracement; a hold here is the last line before the move is likely to be fully reversed.
The limits of Fibonacci retracement
Fibonacci retracement is popular, but it deserves a healthy dose of scepticism. There is no proven reason markets must respect these specific ratios, and much of their apparent power is self-fulfilling: they work partly because so many traders watch the same levels and act around them. The tool is also subjective, since the levels depend entirely on which swing high and low you choose to draw between, and two traders can produce different levels from the same chart. Prices frequently blow through Fibonacci levels or reverse nowhere near them. Used sensibly, as one input for spotting likely areas of support and resistance and always confirmed by other evidence, it is a useful guide. Treated as a precise forecast, it disappoints, which is why it belongs alongside sound risk management and an understanding of your own trading psychology rather than as a system on its own.
Related reading
- Support and resistance: how to identify and trade the levels
- Stop-loss orders: where to place them and the trade-offs involved
- Trading psychology: how fear and greed affect decisions
Frequently asked questions
What are the main Fibonacci retracement levels?
The main levels are 23.6%, 38.2%, 50%, 61.8%, and sometimes 78.6%. Of these, 61.8% (the golden ratio) and 50% are the most closely watched, marking deeper pullbacks that often hold in a healthy trend, while 38.2% is common in stronger trends. The 50% level is not technically a Fibonacci ratio but is included because a halfway retracement is so widely used. Each marks a possible level where a pullback could stall before the trend resumes.
Is Fibonacci retracement reliable?
It is a useful guide rather than a reliable predictor. Much of its effect is self-fulfilling, working because many traders watch the same levels, and there is no proven law forcing markets to respect them. It is also subjective, depending on which swing points you draw from. It is most useful when a Fibonacci level lines up with other evidence, such as an existing support or resistance zone, and least reliable when traded blindly on its own. Sensible traders use it as one input among several, never as a standalone signal.
How do you use Fibonacci retracement for entries?
The typical approach is to trade in the direction of the trend. In an uptrend, you draw the tool from the swing low to the swing high, wait for the price to pull back to a level such as 38.2% or 61.8%, and look to buy there if other signals confirm, placing a stop just below the level and a target near the prior high. The reverse applies in a downtrend. The key is to treat the level as an area of interest that needs confirmation, not an automatic trigger.
What is the golden ratio in trading?
The golden ratio refers to 61.8%, derived from dividing a Fibonacci number by the one after it. In trading it is the most watched retracement level, seen as a significant point where a pullback in a healthy trend often finds support or resistance before the trend continues. Its prominence comes partly from its appearance in mathematics and nature and partly from the sheer number of traders who watch it, which makes price reactions around it more likely through self-fulfilling behaviour.
This article is educational and not financial advice. Trading carries risk and most retail accounts lose money. VLT Markets is a publisher, not a broker.