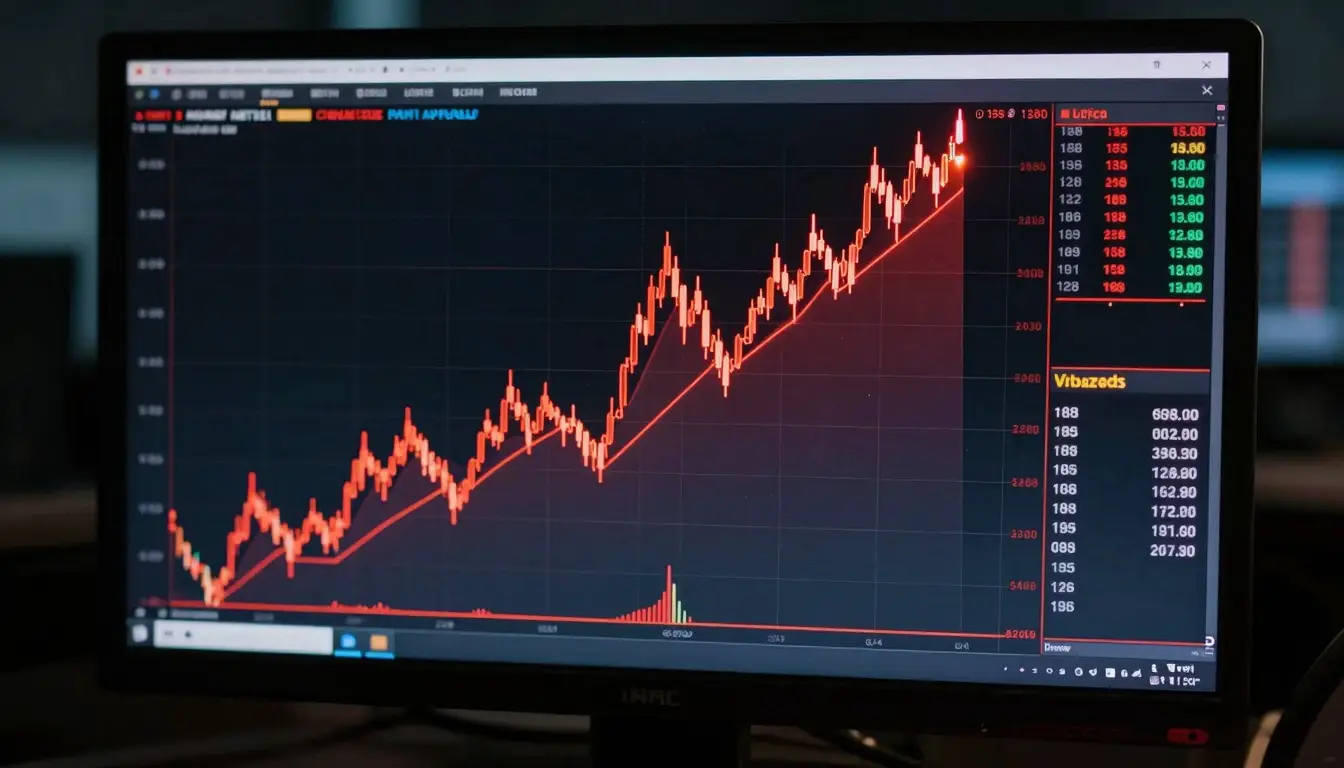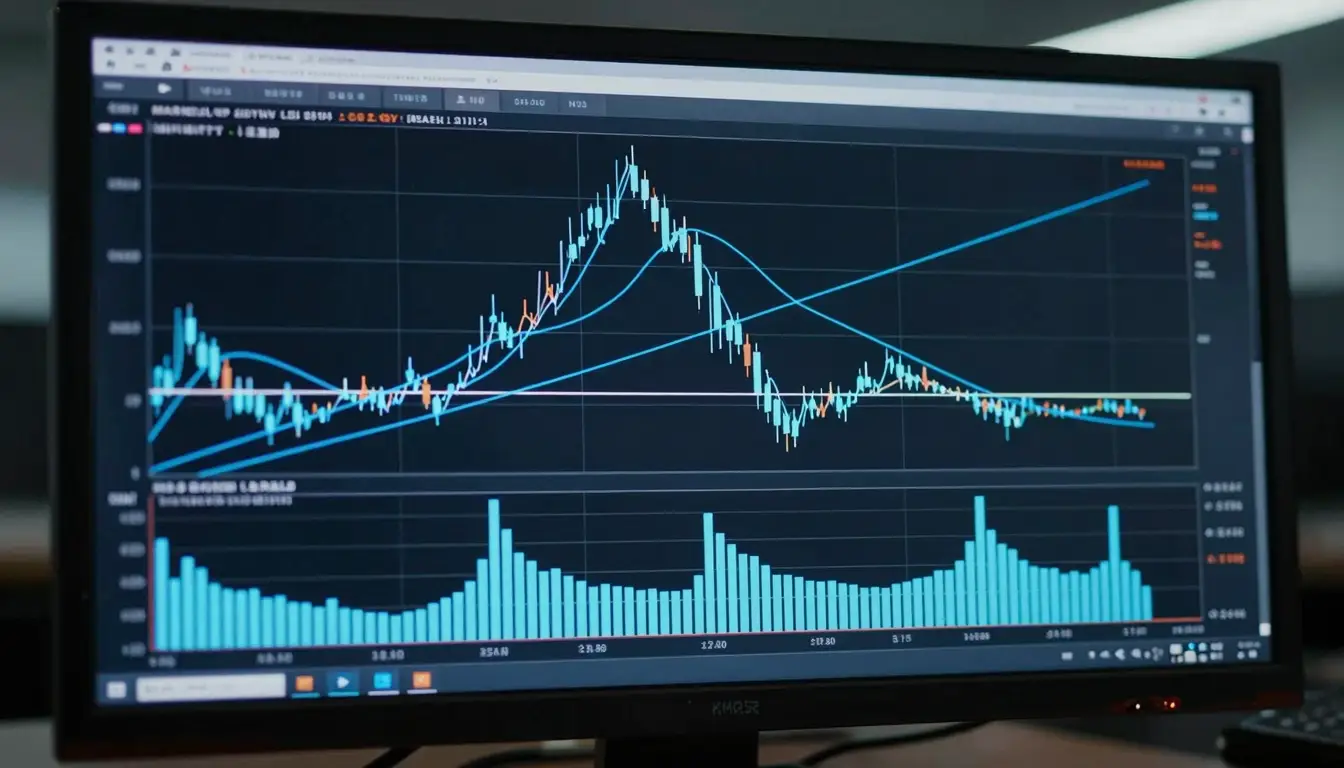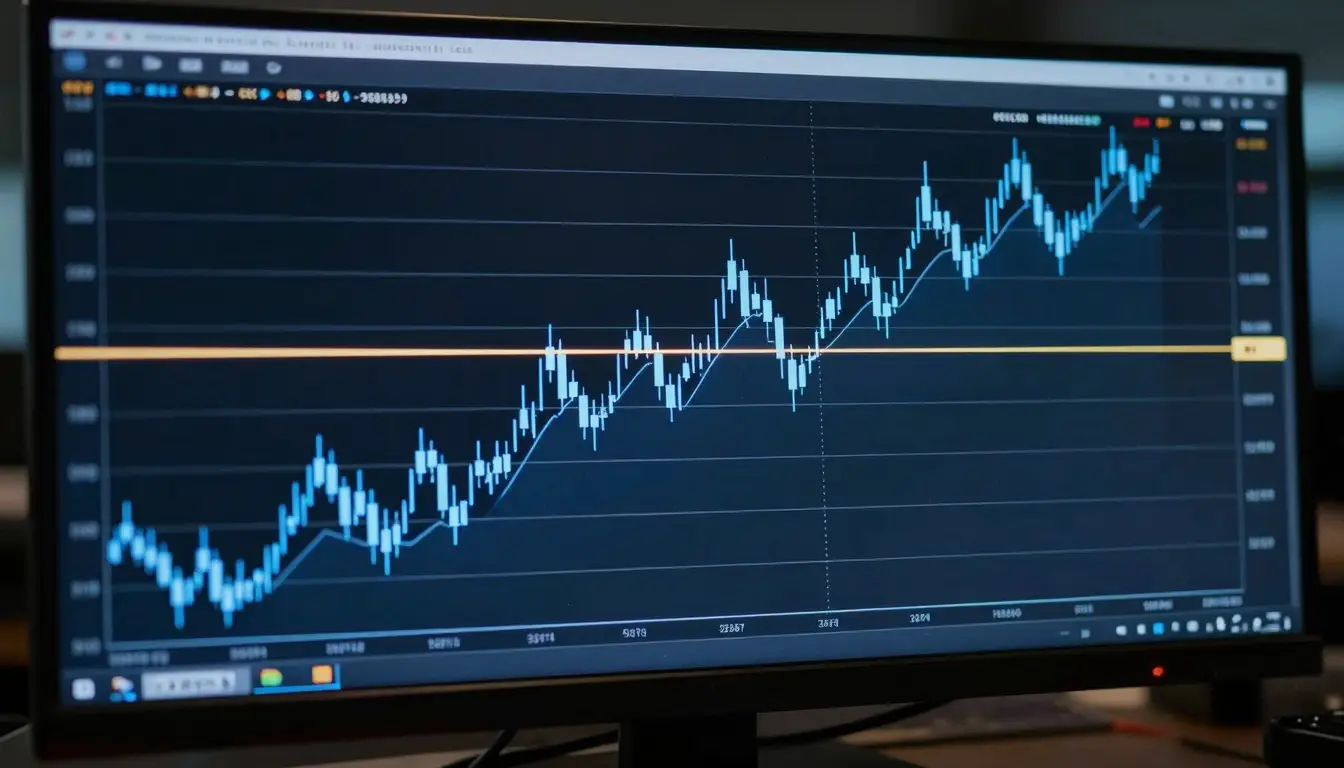
Price action trading is a style that makes decisions from the movement of price itself, read directly off the chart, rather than from indicators built on top of it. A price action trader studies the raw candles, the trend, and levels of support and resistance to judge what buyers and sellers are doing right now, and trades on that read. The appeal is simplicity: a clean chart with no cluttered indicators, focused on the one thing that ultimately matters, the price. This guide explains what price action trading involves, the main tools, and how to approach it sensibly.
Key points:
- Price action trading reads decisions from raw price movement, not from lagging indicators.
- Its core tools are trend, support and resistance, and candlestick signals on a clean chart.
- Because indicators are derived from price, price action traders argue it is better to read the source directly.
- It still needs strict risk management; a clean chart does not remove the need for stops and position sizing.
What is price action trading?
Price action is simply how the price of an asset moves over time, shown as candles or bars on a chart. Price action trading is the practice of basing trades on that movement directly: reading whether the market is trending or ranging, where it has repeatedly turned, and how it behaves as it approaches those levels. Instead of asking “what does my indicator say?”, a price action trader asks “what is the price actually doing here?” The logic is that indicators like moving averages or the RSI are all calculated from price, so they lag it. By reading price itself, the trader aims to see what is happening sooner and with less clutter.
The core tools of price action
- Trend. The first read is direction. A series of higher highs and higher lows is an uptrend; lower highs and lower lows is a downtrend. Price action traders prefer to trade with the trend.
- Support and resistance. The levels where price has repeatedly turned. Much of price action trading happens as the price approaches these levels and either respects or breaks them.
- Candlestick signals. The shape of individual candles, such as a pin bar rejecting a level or an engulfing candle signalling a shift, gives clues about momentum at the moment it matters.
- Chart structure. Broader patterns like ranges, breakouts, and pullbacks, read from the price alone rather than from an overlay.
These are the same building blocks used across technical analysis, but the price action trader relies on them directly and keeps the chart clean rather than layering indicators over the top.
How does a price action trade work?
A typical price action trade follows a logical sequence. First, the trader reads the trend to decide which direction to favour. Second, they identify a key level, such as support in an uptrend, where they would want to buy. Third, they wait for a price action signal at that level, for example a candle that rejects the level and closes strongly back in the trend’s direction, as confirmation that buyers have stepped in. Only then do they enter, placing a stop-loss just beyond the level where the idea would be proven wrong, and a target at the next level of resistance. The whole approach is about waiting for the price to show its hand rather than predicting in advance.
Price action vs indicator trading
The debate between price action and indicator-based trading is really about signal versus noise. Indicator traders value the structure and objectivity that tools like moving averages and the RSI and MACD provide, and the way they can filter emotion out of a decision. Price action traders counter that indicators lag because they are built from past prices, and that a clean chart lets them react faster and adapt to changing conditions. In truth, few traders are purists. Many read price action first and use one or two indicators for confirmation, taking the strengths of both. The right balance depends on temperament as much as anything.
Is price action trading good for beginners?
Price action has a genuine appeal for beginners because it strips the chart back to essentials and builds a real understanding of how markets move, rather than hiding behind signals a trader does not fully grasp. The catch is that reading price well is a skill that takes time and screen hours to develop, and it is more subjective than following a mechanical indicator rule. A sensible way in is to learn the trend, support and resistance, and a handful of candlestick signals, practise reading them on a demo account, and keep risk small while the skill develops. As with every style, the edge comes as much from discipline and managing your own psychology as from the method itself.
Related reading
- Stop-loss orders: where to place them and the trade-offs involved
- Risk-reward ratios: what they mean and how to use them
- Trading psychology: how fear and greed affect decisions
Frequently asked questions
Does price action trading really work?
Price action trading works for many experienced traders, because it is grounded in the one thing that actually determines profit and loss: the price. That said, it is not a shortcut or a guaranteed method, and reading price well takes time to learn. Its success depends on the trader’s skill, discipline, and risk management far more than on the style itself. Like any approach, it produces losses as well as wins, and most beginners lose money while learning, whichever method they choose.
Do you need indicators for price action trading?
No, and many price action traders deliberately trade with a clean chart, using only price, trend, and support and resistance. Others keep one or two indicators, such as a moving average, as a light confirmation while still leading with price. Neither is wrong. The point of price action is to read the market directly rather than depend on lagging tools, but that does not mean indicators are banned; it means price comes first.
What is the difference between price action and technical analysis?
Price action is a part of technical analysis, not a separate discipline. Technical analysis is the broad study of price and volume, which includes indicators, patterns, and price action. Price action is the specific approach within it that focuses on raw price movement and keeps indicators to a minimum. So every price action trader uses technical analysis, but not every technical analyst is a price action purist; many rely heavily on indicators that price action traders play down.
How long does it take to learn price action trading?
Learning the concepts, trend, support and resistance, and the main candlestick signals, takes only a few weeks. Learning to read them reliably in live, messy markets takes much longer, often many months of screen time and practice. There is no fixed timeline, and it depends on how much time you put in and how disciplined you are. Practising on a demo account and keeping a trading record of what works speeds the process considerably.
This article is educational and not financial advice. Trading carries risk and most retail accounts lose money. VLT Markets is a publisher, not a broker.