Support and resistance are the two most important levels in technical analysis. Support is a price level where falling prices have repeatedly found buyers and stopped going down; resistance is a level where rising prices have repeatedly met sellers and stopped going up. Think of support as a floor and resistance as a ceiling. Traders watch these levels because prices tend to react to them again and again, which makes them useful for planning where to enter, where to place a stop, and where to take profit. This guide explains how to find them, how to trade them, and where they fail.
Key points:
- Support is a level where buying tends to halt a fall; resistance is a level where selling tends to halt a rise.
- They form because traders remember past prices and act around them, which makes the levels partly self-fulfilling.
- When a level breaks, it often swaps roles: old resistance becomes new support, and vice versa.
- The two main ways to trade them are bounces off a level and breakouts through it, always with a stop-loss.
What are support and resistance?
Prices do not move randomly through empty space; they pause and turn at levels where enough buyers or sellers step in. Support is a level below the current price where demand has been strong enough to stop declines, as buyers see value and step in. Resistance is a level above the current price where supply has been strong enough to stop advances, as sellers decide to take profit or exit. These levels show up as areas where the price has bounced or stalled more than once. The more times a level has held, and the more volume traded there, the more significant traders consider it, because more participants remember it and act around it.
Why do support and resistance work?
The levels work partly because of memory and partly because they become self-fulfilling. Traders who bought at a support level and did well will buy there again; traders who missed a bounce will place orders to catch the next one; and traders who bought too high near resistance may sell to break even when the price returns. All of this clusters buy and sell orders around the same prices, which reinforces the level. Round numbers add to the effect, since large orders often sit at psychologically important prices. None of this is magic, and levels break regularly, but the behaviour behind them is real and repeats often enough to be useful.
How do you identify support and resistance?
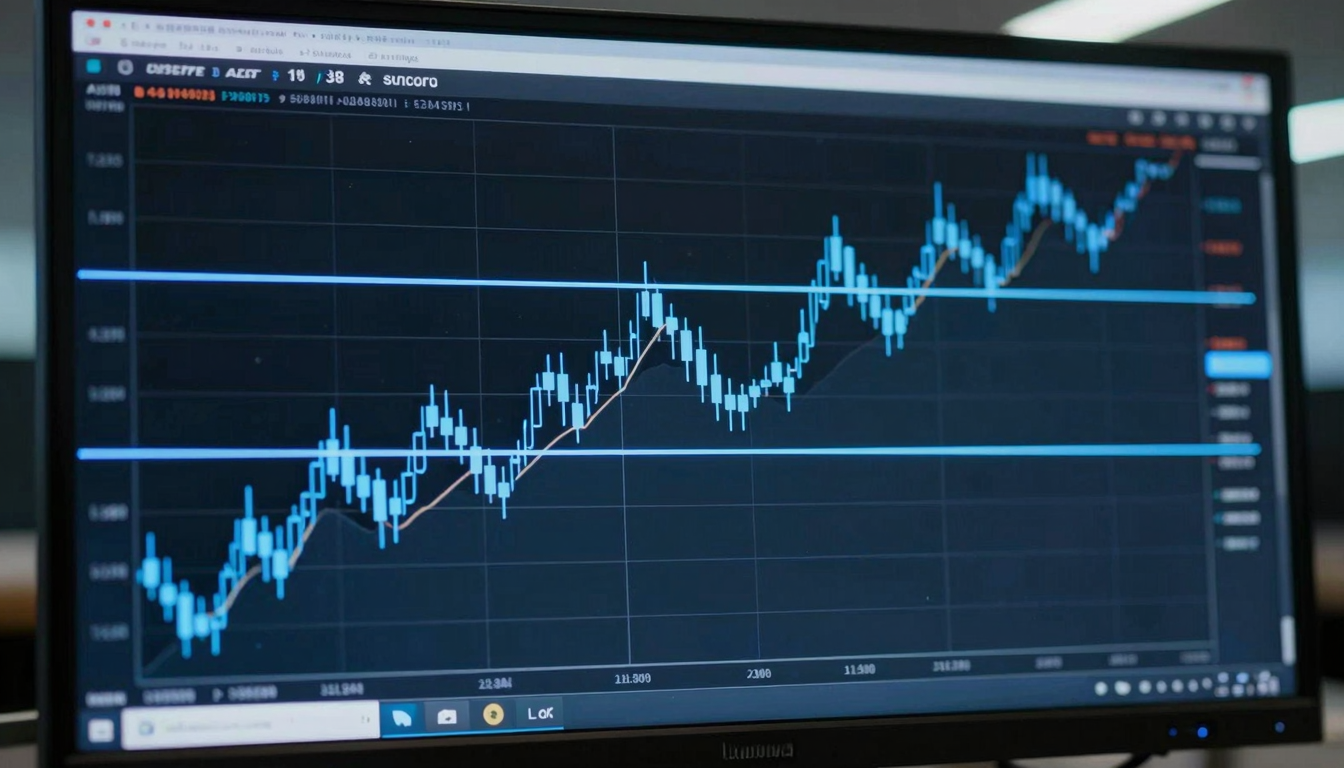
- Horizontal levels. The clearest kind: draw a line across the highs where the price has repeatedly turned down (resistance) or the lows where it has repeatedly turned up (support).
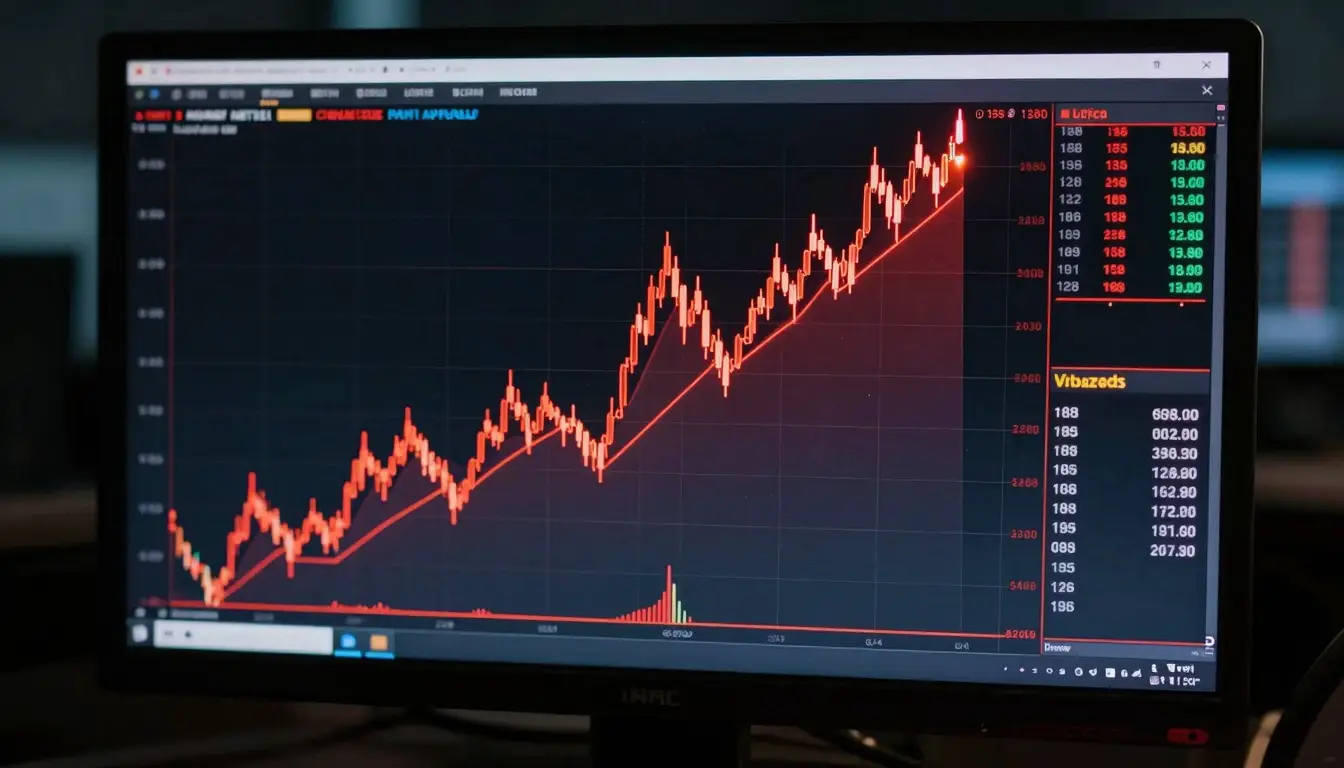
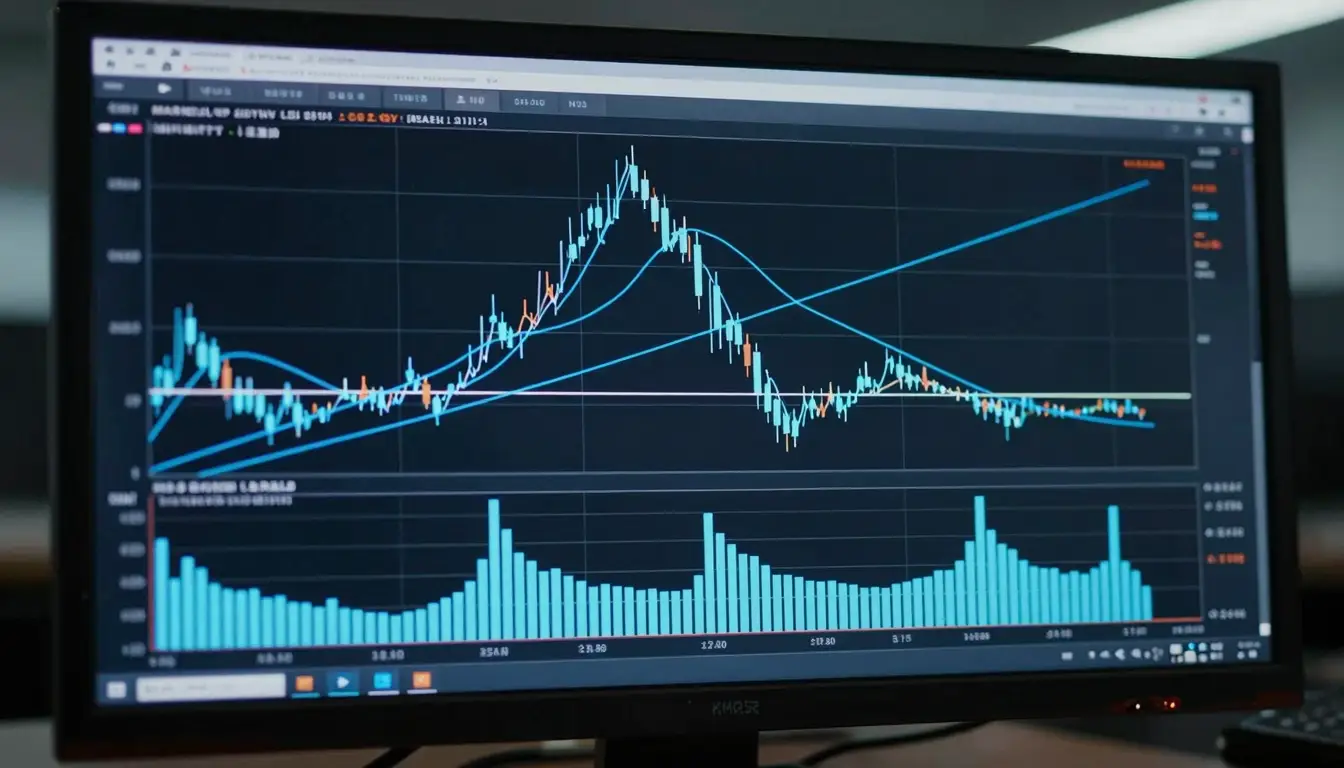
- Trendlines. In a trending market, support and resistance can slope. A rising trendline connecting higher lows acts as support; a falling trendline connecting lower highs acts as resistance.
- Moving averages. A widely watched moving average, such as the 50 or 200 period, often acts as dynamic support or resistance that moves with the price.
- Round numbers. Prices like 100, 1.2000 in forex, or a whole-pound share price frequently act as levels because so many orders cluster there.
It helps to think of support and resistance as zones rather than exact lines. The price often overshoots a level slightly before reacting, so a small band is more realistic than a single precise price.
Role reversal: when support becomes resistance
One of the most useful ideas is that levels swap roles when they break. When the price falls decisively through a support level, that old support often becomes new resistance: traders who bought there and are now underwater sell to break even on any bounce back to it. The same works in reverse: once the price breaks above resistance, that old ceiling frequently becomes a floor on the next pullback. This role reversal is why traders watch a broken level closely for a retest, which can offer a lower-risk entry in the direction of the break.
How do you trade support and resistance?
There are two classic approaches, and both need a defined risk:
- Trading the bounce. Buy near support in an uptrend or sell near resistance in a downtrend, betting the level holds. The stop goes just beyond the level, so if it breaks you are out cheaply. This works best when the wider trend is on your side.
- Trading the breakout. Enter when the price breaks decisively through a level, betting the move continues. The risk here is the false breakout, so wait for a confirmed close beyond the level, ideally on rising volume, and place a stop-loss back inside the old range.
Whichever you use, judge the trade with a risk-reward ratio before entering: a bounce off support with a target at resistance often offers a clean, favourable balance, while a trade squeezed between two nearby levels rarely does.
The limits of support and resistance
Support and resistance are guides, not guarantees. Levels break, sometimes on nothing more than a news headline, and false breakouts are common enough to catch traders on both sides. The levels are also partly subjective: two traders can draw them slightly differently, and hindsight makes them look cleaner than they were live. They work best combined with the wider trend, volume, and other tools rather than in isolation, and always with a stop-loss so a broken level costs little. Sticking to your plan when a level is being tested, instead of reacting to every wobble, is as much about trading psychology as about the chart.
Related reading
- Stop-loss orders: where to place them and the trade-offs involved
- Risk-reward ratios: what they mean and how to use them
- Position sizing: how to calculate the right trade size
Frequently asked questions
How do you know if a support level will hold?
You never know for certain, but some levels are stronger than others. A level that has held several times, that saw high volume, and that aligns with the wider trend is more likely to hold than a minor one tested once. Even so, any level can break, which is why traders who buy at support place a stop-loss just below it. The point is not to predict with certainty but to take trades where the level holding is likely and the cost of being wrong is small.
What is the difference between support and resistance?
Support sits below the current price and marks a level where buying has tended to stop falls, acting like a floor. Resistance sits above the current price and marks a level where selling has tended to stop rises, acting like a ceiling. They are the same idea viewed from opposite sides. When one breaks, it often turns into the other: broken support becomes resistance, and broken resistance becomes support.
Are support and resistance zones or exact lines?
They are better treated as zones than exact prices. The price often pokes slightly beyond a level before reacting, and orders cluster around an area rather than a single number. Drawing a narrow band instead of a precise line gives a more realistic picture and helps you avoid being stopped out by a small overshoot that was never a genuine break. Experienced traders usually think in terms of these areas rather than one exact price.
Do support and resistance work in all markets?
Yes, the concept applies across shares, forex, commodities, indices, and crypto, because it reflects universal trader behaviour around remembered prices. The levels tend to be cleaner in liquid, heavily traded markets where many participants watch the same prices, and messier in thin or highly volatile markets. The principle holds everywhere, but you should judge the reliability of any given level by how it behaves in that specific market.
This article is educational and not financial advice. Trading carries risk and most retail accounts lose money. VLT Markets is a publisher, not a broker.