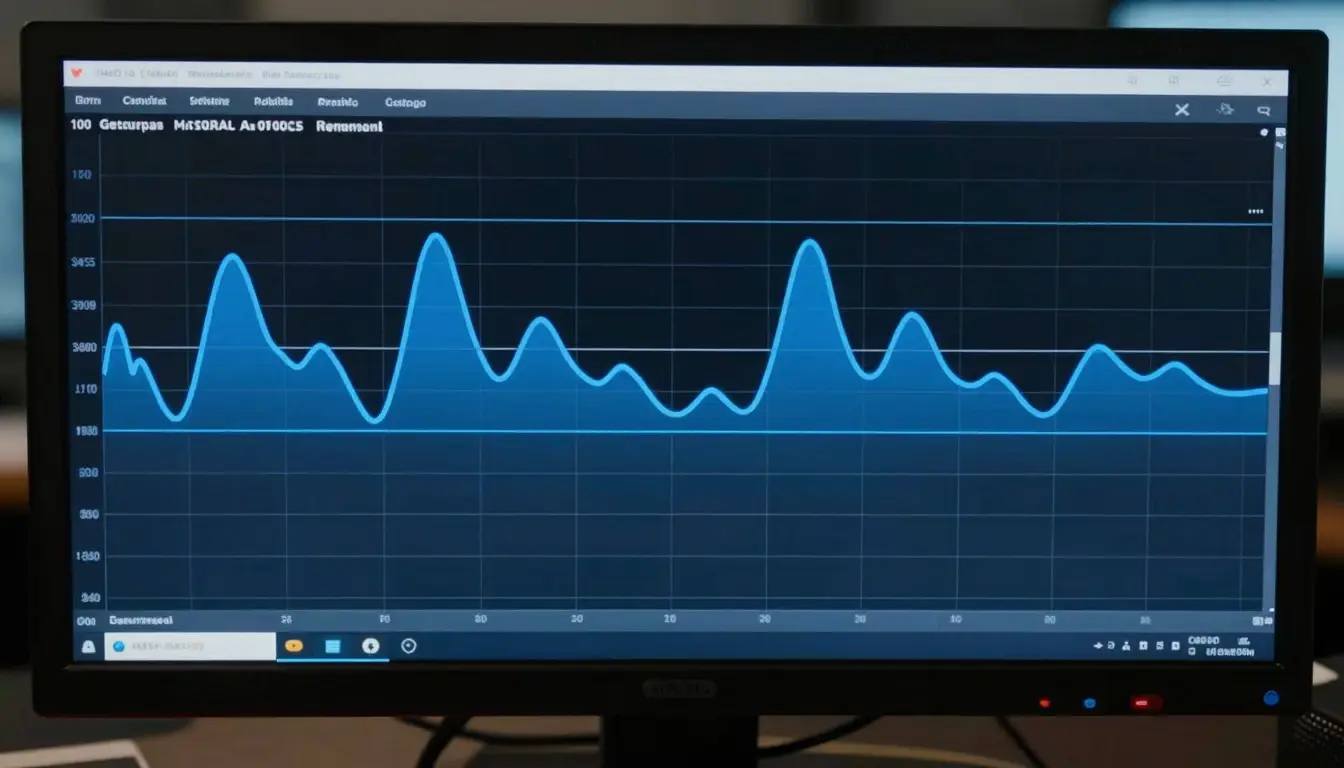
The RSI indicator, or Relative Strength Index, is a momentum measure of how fast and how far a price has moved recently, on a scale from 0 to 100. Traders use it to judge whether an asset may be overbought (stretched after a strong rise) or oversold (stretched after a sharp fall), and to spot momentum shifts before they show up clearly in price. A reading above 70 is traditionally seen as overbought and below 30 as oversold. It is one of the most widely used indicators in technical analysis, and this guide explains how it works, how to read it, and the mistakes to avoid.
Key points:
- The RSI measures the momentum of recent price moves on a 0 to 100 scale, usually over 14 periods.
- Above 70 is considered overbought and below 30 oversold, but these are signals to pay attention, not automatic buy or sell triggers.
- RSI divergence, where price and RSI move in opposite directions, can hint at a weakening trend.
- In a strong trend the RSI can stay overbought or oversold for a long time, so it works best alongside other tools.
What is the RSI?
The Relative Strength Index was developed by J. Welles Wilder and introduced in 1978. It is an oscillator, which means it moves back and forth within a fixed range, in this case 0 to 100. The RSI compares the size of an asset’s recent gains with the size of its recent losses to produce a single number that reflects momentum. When gains dominate, the RSI rises towards 100; when losses dominate, it falls towards 0. The idea is not to measure the price itself but the strength and speed behind its moves, which can reveal when a trend is losing steam.
How is the RSI calculated?
You do not need to calculate the RSI by hand, as every charting platform does it for you, but understanding the mechanics helps you read it. The standard setting looks at the last 14 periods (14 days on a daily chart). It takes the average gain on up periods and the average loss on down periods over that window, forms a ratio of the two, and converts it into a number between 0 and 100. The practical takeaway is what the components mean: a high RSI means recent gains have strongly outweighed losses, and a low RSI means the opposite. The 14-period setting is the default, but some traders shorten it to make the RSI more sensitive or lengthen it to smooth out the noise.
How do you read overbought and oversold?
The best-known use of the RSI is the overbought and oversold levels. A reading above 70 suggests the price has risen quickly and may be due a pause or pullback; a reading below 30 suggests it has fallen quickly and may be due a bounce. The crucial point beginners miss is that these are not automatic signals to sell or buy. An overbought reading in a powerful uptrend can persist for weeks while the price keeps climbing, and selling simply because the RSI hit 70 is a common way to exit a good trend far too early. Treat 70 and 30 as prompts to look more closely, confirmed by price action and the wider trend, rather than as triggers on their own.
What is RSI divergence?
Divergence is one of the more useful RSI signals. It happens when the price and the RSI disagree. In a bearish divergence, the price makes a higher high but the RSI makes a lower high, suggesting the upward momentum is fading even as the price rises, which can warn of a coming reversal. In a bullish divergence, the price makes a lower low but the RSI makes a higher low, hinting that selling pressure is easing. Divergence does not guarantee a turn, and it can persist for a while before anything happens, but it is a helpful early warning that a trend may be running out of energy.
How do traders use the RSI in practice?
- Confirming momentum. Using the RSI to check whether a move has strength behind it, rather than trading it in isolation.
- Spotting exhaustion. Watching for overbought or oversold readings combined with divergence as a sign a trend may be tiring.
- The centre line. Some traders treat the 50 level as a dividing line, viewing readings above 50 as bullish momentum and below 50 as bearish.
- Combining with other tools. Pairing the RSI with support and resistance or other indicators such as MACD so signals confirm one another rather than relying on any single reading.
Whatever the approach, the RSI never removes the need for risk control. A signal is a probability, not a promise, so every trade still needs a stop-loss and a sensible position size.
The limits of the RSI
The RSI’s biggest weakness is the one already mentioned: in a strong trend it can stay overbought or oversold far longer than seems reasonable, generating false signals for anyone who trades those levels mechanically. It also lags, because it is built from past prices, and it can whipsaw in choppy, directionless markets. Like every indicator, it is a tool for weighing probabilities, not a system that works on its own. It performs best in combination with an understanding of the trend, of support and resistance, and of your own discipline, since acting on a signal you do not trust is where many traders come unstuck. Handling that uncertainty calmly is part of trading psychology.
Related reading
- RSI, MACD, and Bollinger Bands: how these indicators work
- Stop-loss orders: where to place them and the trade-offs involved
- Trading psychology: how fear and greed affect decisions
Frequently asked questions
What is a good RSI setting?
The standard setting is 14 periods, which Wilder originally proposed and which remains the default on most platforms. A shorter setting, such as 9, makes the RSI more sensitive and produces more signals, including more false ones; a longer setting, such as 21, smooths it out and produces fewer, slower signals. There is no universally best setting; the right choice depends on your time frame and style, and most traders do well to start with the default 14 before experimenting.
Does RSI above 70 mean I should sell?
Not on its own. An RSI above 70 means momentum has been strong and the price may be stretched, but in a powerful uptrend it can stay above 70 for a long time while the price keeps rising. Selling automatically at 70 often means leaving a strong trend too early. Treat it as a prompt to look for other evidence, such as divergence, a break of support, or a reversal candle, before acting rather than as a sell signal by itself.
What is the difference between RSI and MACD?
Both are momentum indicators, but they measure it differently. The RSI is an oscillator bounded between 0 and 100 that highlights overbought and oversold conditions. The MACD tracks the relationship between two moving averages and is unbounded, focusing on the direction and strength of momentum and on crossovers between its lines. Many traders use them together, with the RSI flagging stretched conditions and the MACD confirming the direction of momentum.
Is the RSI reliable?
The RSI is a useful and popular tool, but no indicator is reliable enough to trade blindly. It gives false signals in strong trends and in choppy markets, and it lags because it is based on past prices. It is most reliable when used to confirm what other analysis already suggests, combined with the trend, support and resistance, and firm risk management. Treated as one input among several rather than a standalone system, it earns its place; treated as a magic signal, it disappoints.
This article is educational and not financial advice. Trading carries risk and most retail accounts lose money. VLT Markets is a publisher, not a broker.