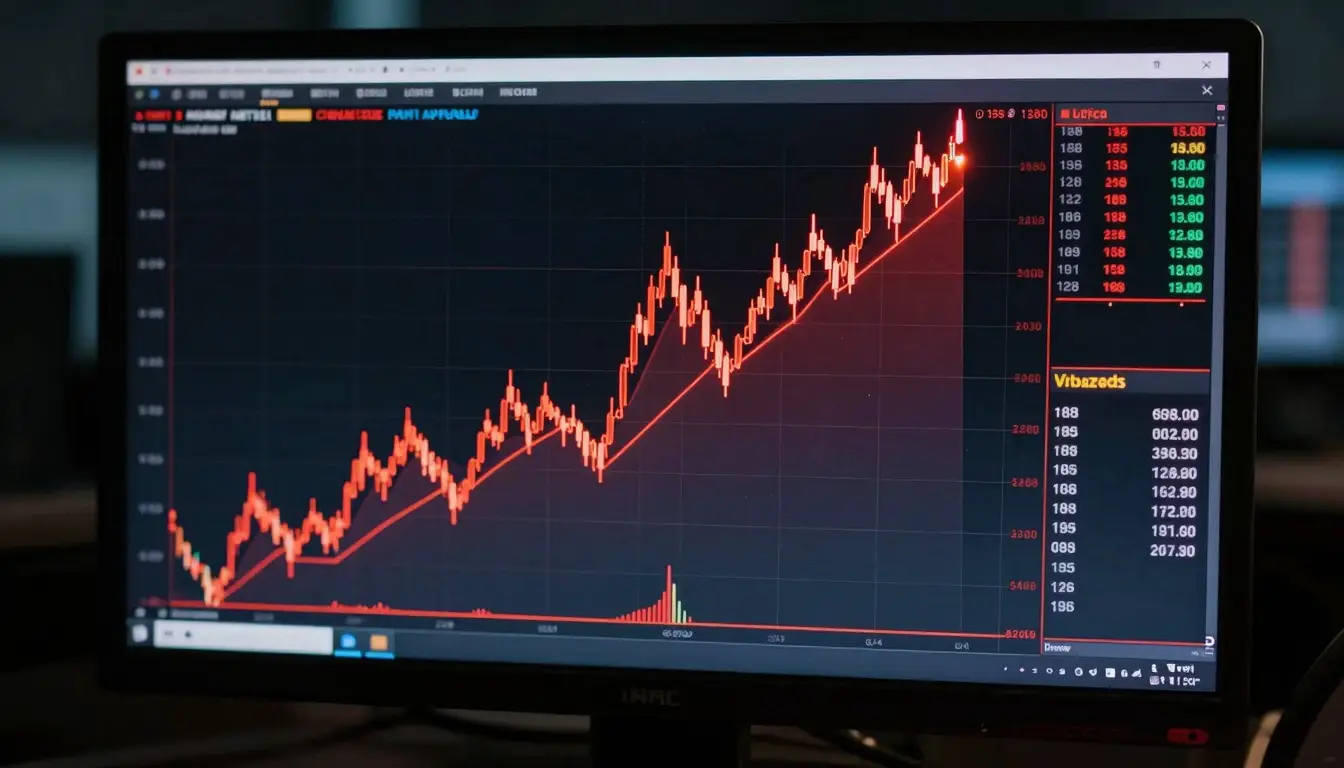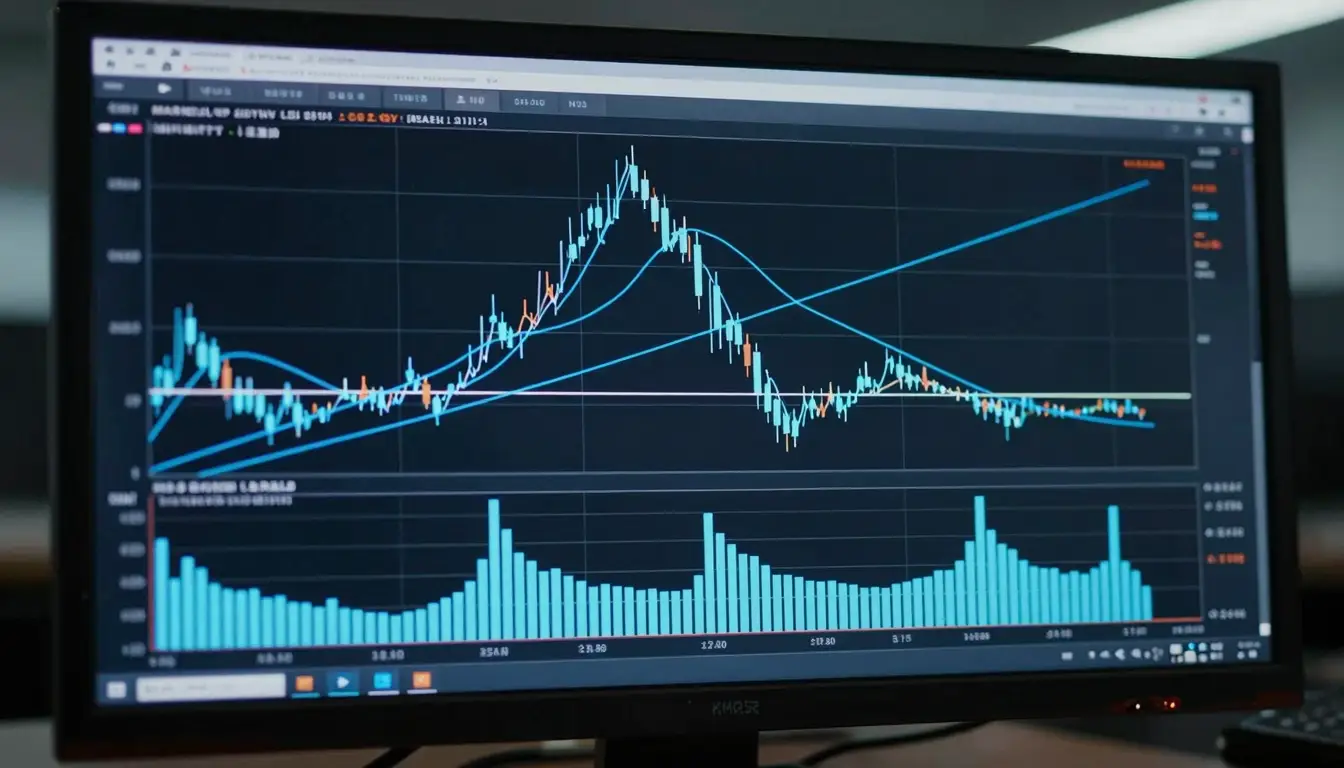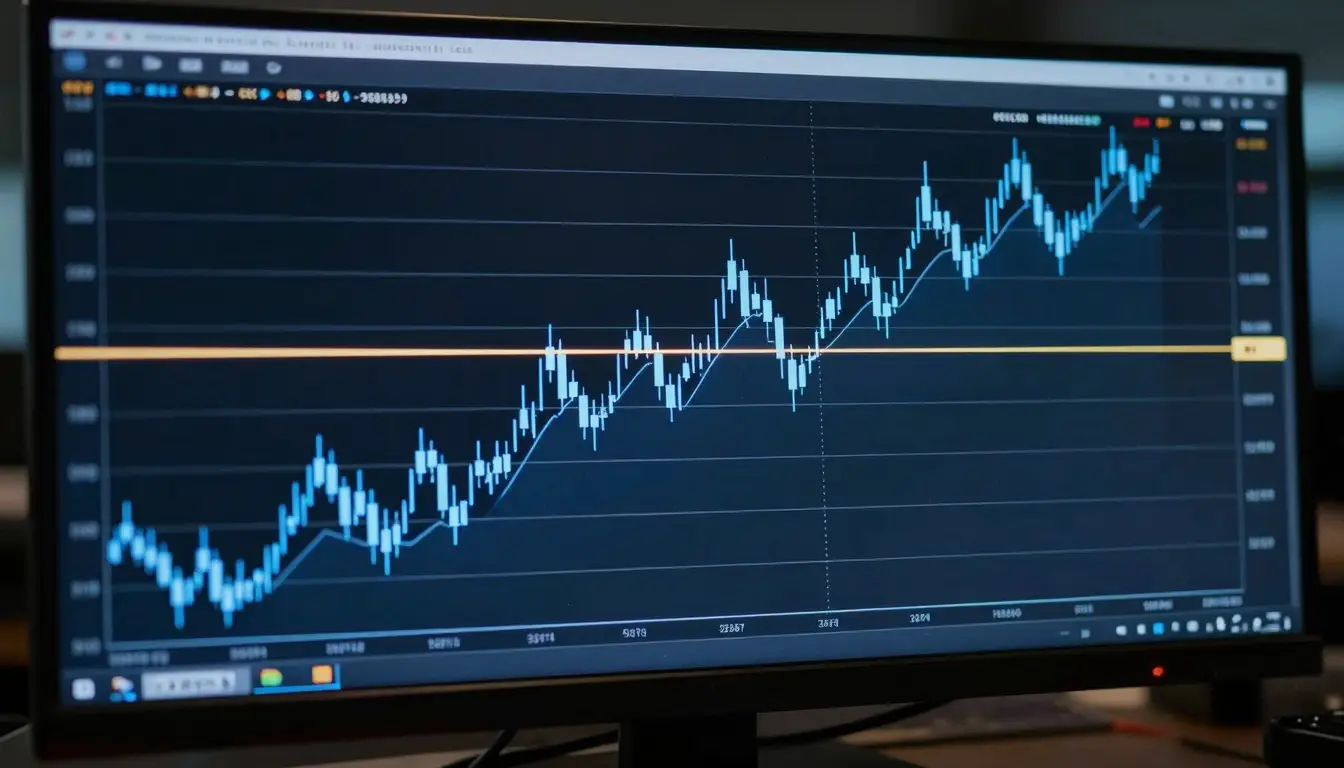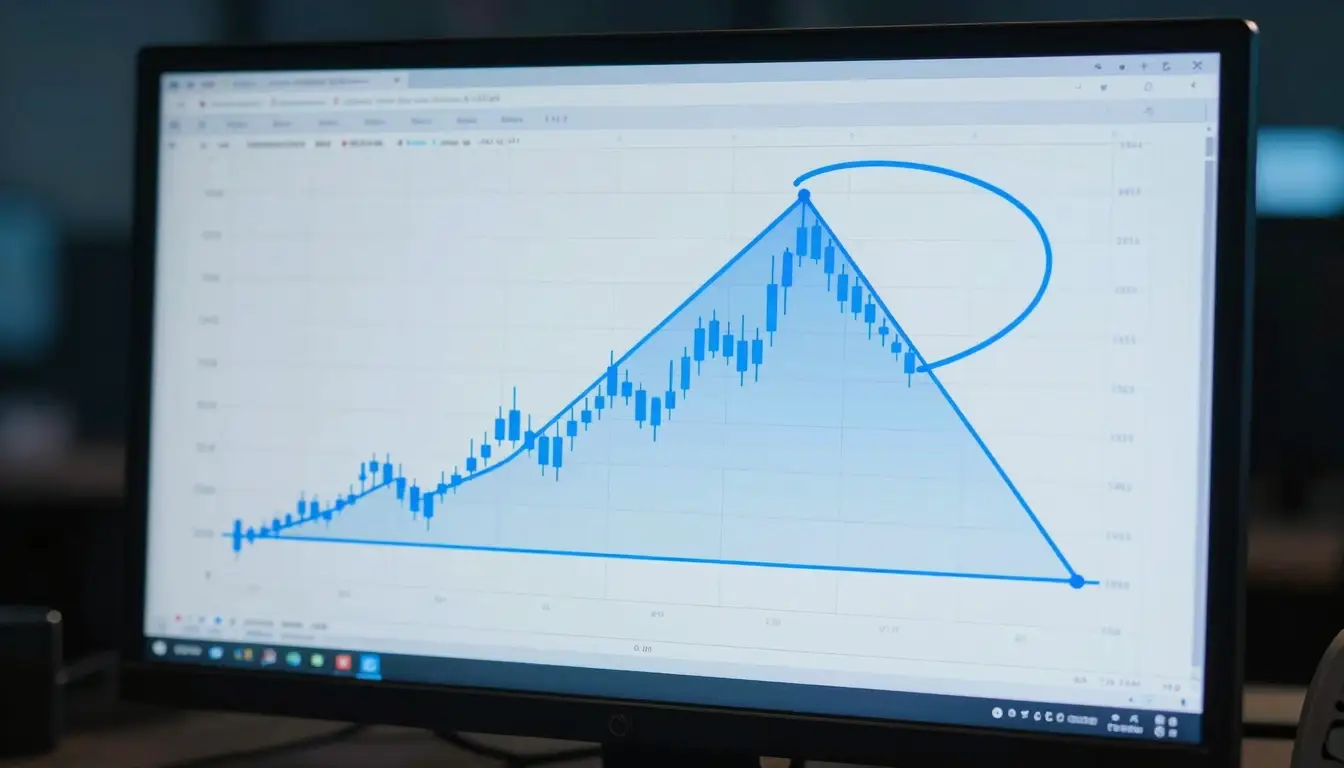
Chart patterns are recognisable shapes that price forms on a chart, and traders use them to judge whether a trend is likely to continue or reverse. They work because they are a visual record of the battle between buyers and sellers: a pattern captures a moment where that balance is shifting, and it hints at where the price may go next. No pattern is a guarantee, and plenty fail, but learning the main ones gives you a shared language for reading a chart and a framework for planning entries, exits, and risk. This guide covers the patterns worth knowing, how to trade them, and how to avoid the common traps.
Key points:
- Chart patterns fall into two families: continuation patterns, which suggest the trend resumes, and reversal patterns, which suggest it turns.
- They describe probability, not certainty; patterns fail often, so every trade still needs a stop and a defined risk.
- Volume and the wider trend confirm a pattern; a breakout on weak volume is more likely to fail.
- The most useful patterns for beginners are support and resistance breaks, triangles, flags, double tops and bottoms, and head and shoulders.
What are chart patterns and why do they work?
A chart pattern is a shape formed by price movement that has tended to precede a particular kind of move often enough that traders watch for it. They are a form of technical analysis, which studies price and volume rather than a company’s fundamentals. The reasoning is that markets are driven by human behaviour, and human behaviour repeats. Fear, greed, and the herd instinct show up as the same shapes again and again: a level where buyers keep stepping in, a squeeze where a range tightens before it breaks, a failed push to a new high that signals exhaustion. Patterns work to the extent that enough traders act on them, which becomes partly self-fulfilling, and to the extent they reflect a genuine shift in supply and demand. They fail when the crowd is wrong or when bigger forces override the setup, which is why they are a tool for stacking the odds, not a crystal ball.
Continuation patterns
Continuation patterns form during a pause in a trend and suggest the trend will resume once the pause ends. They represent the market catching its breath.
- Flags and pennants. After a sharp move, the price drifts sideways or slightly against the trend in a tight range, forming a small flag or triangle, then breaks out in the original direction. They are short-term patterns that often resolve quickly.
- Triangles. An ascending triangle (flat top, rising lows) leans bullish; a descending triangle (flat bottom, falling highs) leans bearish; a symmetrical triangle (both converging) can break either way and you trade the direction it breaks. The tightening range reflects indecision before a decisive move.
- Cup and handle. A rounded bottom shaped like a cup, followed by a small dip (the handle), then a breakout higher. It signals a pause and re-accumulation within an uptrend.
Reversal patterns
Reversal patterns form at the end of a trend and suggest it is about to turn. They mark a shift in control from buyers to sellers, or the reverse.
- Head and shoulders. Three peaks, the middle one (the head) higher than the two shoulders, with a neckline connecting the lows between them. A break below the neckline signals a top and a likely move down. The inverse version, forming at a bottom, signals a move up.
- Double top and double bottom. The price tests a level twice and fails to break through, forming an “M” at a top or a “W” at a bottom. Two rejections of the same level suggest the trend behind it is running out of strength.
- Rising and falling wedges. A wedge slopes in one direction while narrowing. A rising wedge often precedes a fall, and a falling wedge often precedes a rise, making them counter-intuitive but useful reversal clues.
Support, resistance, and the breakout
Underneath almost every pattern sit two ideas: support, a level where buying has repeatedly stopped a fall, and resistance, a level where selling has repeatedly capped a rise. Patterns are really just structured ways these levels get tested and broken. A breakout is when the price finally pushes decisively through one of them, and it is the moment most pattern trades are triggered. The catch is the false breakout, where the price pokes through a level, lures traders in, then snaps back. This is why confirmation matters, and why a stop-loss placed on the wrong side of the level is essential: it caps the damage when a breakout fails.
How do you trade a chart pattern?
The mechanics are similar across most patterns, and the discipline matters more than the shape:
- Identify the pattern in context. A pattern is more reliable when it fits the wider trend. A bullish flag in an uptrend is stronger than the same flag in a falling market.
- Wait for confirmation. Rather than anticipating the breakout, wait for the price to actually close beyond the level, ideally on rising volume, which shows conviction behind the move.
- Plan the entry, stop, and target before you trade. Enter on the confirmed break, place a stop-loss just back inside the pattern where the setup would be proven wrong, and set a target using the pattern’s measured move (for example, the height of a triangle or head and shoulders projected from the breakout).
- Check the risk-reward. Only take the trade if the potential reward justifies the risk. A pattern that offers a 3:1 risk-reward ratio is worth more than one offering 1:1, even if both look clean.
Why volume matters
Volume is the sanity check on a pattern. A breakout backed by a surge in volume shows that many participants are acting on the move, which makes it more likely to hold. A breakout on thin volume is suspect, because it can be a handful of orders that quickly reverse. In continuation patterns like flags, volume typically shrinks during the pause and expands on the breakout. Watching volume alongside the shape filters out a good share of the false signals that catch traders who trade the pattern in isolation.
The limits of chart patterns
Two honest caveats keep patterns in proportion. First, they are subjective: five traders can look at the same chart and draw the pattern five slightly different ways, and hindsight makes patterns look far cleaner than they were in real time. Second, they fail regularly, and there is no pattern with a reliable published success rate you can bank on. Patterns are best used as one input among several, alongside the trend, volume, and support and resistance, and always with strict risk control. The trader who treats a pattern as a probability and protects every trade with a stop will do far better than one who treats it as a promise. Managing the emotions that a “textbook” setup stirs up is part of the job, which is why trading psychology deserves as much attention as pattern recognition.
Related reading
- Stop-loss orders: where to place them and the trade-offs involved
- Risk-reward ratios: what they mean and how to use them
- Position sizing: how to calculate the right trade size
- Trading psychology: how fear and greed affect decisions
Frequently asked questions
Do chart patterns actually work?
Chart patterns work as probability tools, not certainties. They reflect real shifts in supply and demand and become partly self-fulfilling because many traders act on them, but they fail often and no pattern has a guaranteed success rate. Used well, alongside the wider trend, volume, and strict risk control, they help stack the odds and structure a trade. Used as a promise, on their own, they lead to losses. The edge is in the discipline around the pattern as much as the pattern itself.
What is the most reliable chart pattern?
There is no single most reliable pattern, and any source claiming a fixed success percentage is overstating the case. That said, patterns built on clear support and resistance, such as a well-tested double top or bottom or a clean head and shoulders confirmed by volume, tend to be among the more dependable because they reflect obvious levels many traders watch. Reliability rises when a pattern aligns with the wider trend and the breakout comes on strong volume.
What is the difference between chart patterns and candlestick patterns?
Chart patterns are large shapes formed by price over many sessions, such as a head and shoulders or a triangle, and they describe the bigger structure of a move. Candlestick patterns are much smaller, usually one to three candles, and they signal short-term shifts in momentum, such as a hammer or an engulfing candle. Many traders use them together: the chart pattern frames the setup, and a candlestick signal helps time the entry.
How long does it take to learn chart patterns?
Recognising the main patterns takes only a few weeks of study, but reading them well in live markets, where they are messy and ambiguous, takes much longer. The faster route is to focus on a handful of patterns, study them on real charts, and practise on a demo account before risking money. Trying to memorise every pattern at once is less useful than knowing a few deeply and combining them with sound risk management.
This article is educational and not financial advice. Trading carries risk and most retail accounts lose money. VLT Markets is a publisher, not a broker.